Thursday, August 13, 2020

Gold Prices Show There's A "Big Short" Going On In Official Currencies

 Authored by Thorstein Polleit vioa The Mises Institute,

On August 4, 2020, the price of gold surpassed $2,000 per ounce.

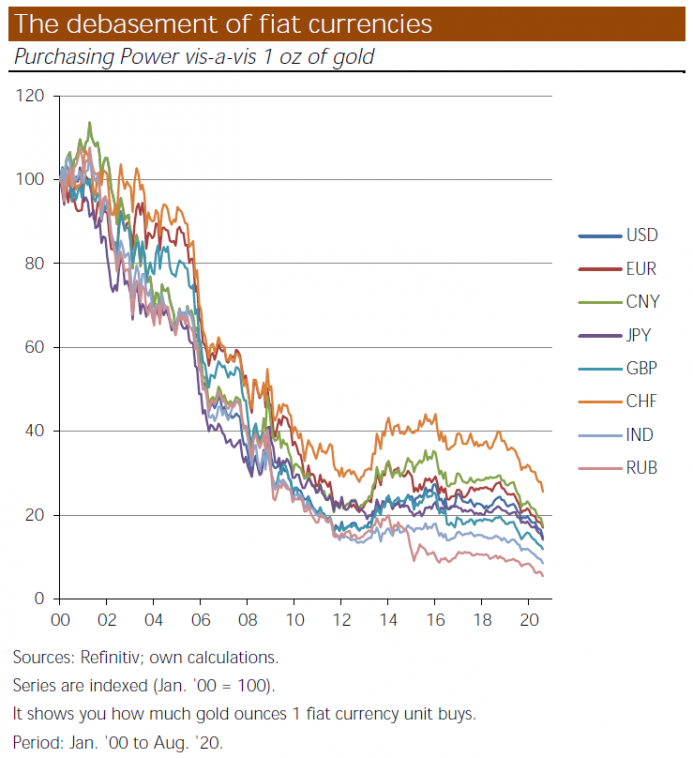
While one may say that the price of gold is on the rise, it would actually be more meaningful to say that the purchasing power of the world’s fiat currencies vis-à-vis gold is on the decline...

...because this is what a rising price for gold and silver in, say, US dollars, euros, Chinese renminbi, Japanese yen, or Swiss francs really stands for: The higher the price of this precious metal, the lower the exchange value of official currencies.

Gold isn’t just a good like any other.

It is special: it is the “ultimate means of payment,” the “base money of civilization.”

 Monetary history bears this out: whenever people were free to choose their money, they went for gold. Indeed, gold has all the physical properties that make for sound money: gold is scarce, homogenous, easily transportable, divisible, mintable, durable, and, last but not least, has a relatively high value per unit of weight. Even though officially demonetized in the early 1970s, people haven’t stop appreciating gold’s “moneyish” qualities.

However, it is not only the rising gold price that indicates that the purchasing power of fiat currencies is on the decline. Basically, all other goods prices go up as well, most notably asset prices—the prices of stocks, bonds, housing, and real estate. This means that you can buy fewer and fewer stocks, bonds, and houses with a given official currency unit. From this perspective, you can rightfully conclude that a broad-based debasement is going on as far as the world’s major official fiat currencies are concerned.

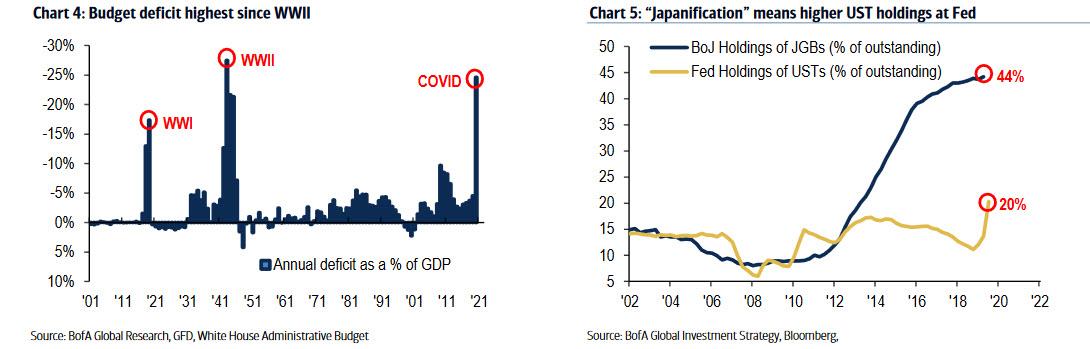
Of course, this is not what most people would wish for, as they prefer to hold a kind of money that doesn’t go down in value, money that actually preserves or even increases its purchasing power over time. Actually no one who is in his right mind would wish to hold inflationary money. Unfortunately, however, central banks have been debasing their official fiat currencies over the last decades. To make things even worse, the monetary debasement is gathering speed due to the consequences of the politically dictated lockdown crisis.

Central banks around the world print up ever greater amounts of fiat currencies to make up for lost income and profits. It is against this background that the rise of goods prices in terms of official currencies can be interpreted in a meaningful way: the rise in the quantity of money will, as an economic law, cause the exchange value of the money unit to go down—either in absolute terms or in relative terms (that is by keeping money prices at a higher level when compared to a situation in which the quantity of money has not been increased).

In view of central banks‘ expansion of the quantity of fiat currency, people increasingly seek to hold assets, such as, say, stocks, housing, real estate, and commodities, that are considered to be "inflation protected." As they exchange fiat currencies for other goods, the money prices of these goods are bid up, and higher money prices are equivalent to a decline in the purchasing power of fiat currencies. Of course, financial market traders will be among the first to react and benefit, while those less informed will get the shaft.

In a world in which central banks not only ramp up the quantity of fiat currency but also push market interest rates to zero, people get hit particularly hard. Saving in traditional instruments (bank deposits, money market funds, etc.) is made impossible. The artificially lowered interest rates also contribute to asset price inflation: the prices of stocks and real estate are driven upward. Those holding fiat currencies suffer losses as far as their purchasing power is concerned, while people who hold assets that gain in price are on the receiving end.

Unfortunately, an end to central banks’ inflationary policies is not in sight. There is the widespread and deeply entrenched belief among people that an increase in the quantity of fiat currency would make the economy richer, and that it would help overcome financial and economic crises. This is, however, a serious mistake, for all an increase in the stock of money does is make some richer at the expense of many others. And an inflation policy can cover up economic and financial problems only for so long.

Ludwig von Mises wrote:

The collapse of an inflation policy carried to its extreme—as in the United States in 1781 and in France in 1796—does not destroy the monetary system, but only the credit money or fiat money of the State that has overestimated the effectiveness of its own policy. The collapse emancipates commerce from etatism and establishes metallic money again.1

Mises’s words should help us to better understand why the appreciation of gold (and lately also silver) vis-à-vis the fiat currency universe has been underway for quite some time now.

Wednesday, August 12, 2020

Triple-Inverse Nat Gas ETN Goes Berserk, Explodes By $10,000 In Minutes

 From Zero Hedge: 

It's a quietish day in Nattie futures - down just over 2% but coming back a little now...

The NatGas term structure is 'normal'...

But you wouldn't know that if you are "invested" in the VelocityShares Daily 3x Inverse Natural Gas ETN...

For some context, this is a $12,000-plus surge in the price... as one market watcher exclaimed "something's f**king broken."

Did someone just get "Cordier"-ed?

For some color, the last three days have been extremely chaotic with manic runs likely driven by HFT algos...

Monday started the chaos...

Then Tuesday saw a major ask spike in the middle of the day but no trade at that level...

Then there's today...


And all the moves were on tiny volumes again suggesting this was not Robinhood'rs or retail malarkey.

As Bloomberg's ETF analyst, James Seyffart, notes, Credit Suisse may need to consider shuttering the (DGAZF), after pricing broke down and the exchange-traded note closed with a 645% premium to net asset value yesterday, and it traded as much as 3,900% above NAV because market makers lack the ability to create new shares to meet demand.

Can we get a better market!!??

There Are Now Less Than 3,000 US Listed Companies And Over 7,000 Global ETFs

 From Zero Hedge:

ETFs used to be touted as a great way to gain exposure to the stock market. But now, thanks to fee-hungry issuers, the tail is wagging the dog and ETFs are the stock market. 

As far back as late 2017, there were just 3,671 domestic listings, according to the Wall Street Journal. The number had declined due to the growth of venture capital and private equity.

"The number of public companies in the U.S. has been on a steady decline since peaking in the late 1990s. In 1996 there were 7,322 domestic companies listed on U.S. stock exchanges. Today there are only 3,671. Easy access to venture, growth and private-equity capital means that companies no longer need to pursue an initial public offering to fund growth or access liquidity," the WSJ wrote about 3 years ago.

Since then, the number has continued to decline. Yesterday on CNBC, it was reported that there are now less than 3,000 public listings. But there's now more than 7,000 ETFs globally. 

Number of ETFs worldwide from 2003 to 2019 (Statista)

We have often discussed the liquidity crisis that could be created from passive investing in ETFs as their popularity grows. Additionally, the use of ETFs as trading vehicles instead could wind up distorting the true price of the underlying stocks held within them. 

Late last year we noted that passive funds had surpassed active funds thanks to the Fed basically making active investing obsolete. Retail masses followed this lead, which has spurred the demand for ETFs that have allowed them to continue to pop up at an alarming rate. 

Recall, back in September of 2019, Michael Burry had claimed that "Passive investments such as index funds and exchange-traded funds are inflating stock and bond prices in a similar way that collateralized debt obligations did for subprime mortgages more than 10 years ago."


He continued: “Like most bubbles, the longer it goes on, the worse the crash will be. This is very much like the bubble in synthetic asset-backed CDOs before the Great Financial Crisis in that price-setting in that market was not done by fundamental security-level analysis, but by massive capital flows based on Nobel-approved models of risk that proved to be untrue.”

In case anyone has wondered just how long it has gone on, the widening delta between listed companies and global ETFs gives an indication of exactly how distorted things have become. 

Signup to get Second Sight analysis by Crediblock

Monday, August 10, 2020

The Days Of Tracking Robinhood Data Are Now Officially Over

 From Zero Hedge:

For years, the website RobinTrack.net has been doing a great job of mining RobinHood's data to provide raw data and a visualization of which stocks the users of the retail brokerage have been holding and disposing of on a daily basis.

RobinTrack.net has been a wonderful way to keep an eye on exactly what stocks the bagholder crowd have been rushing into on a daily basis, providing insight into the hysteria of retail daytraders, allowing hedge funds to likely frontrun the data and providing opportunities for short sellers looking for ideas.

But those days appear to be all but over.

On Friday, CNBC reported that the brokerage will no longer display how many of its users hold a certain stock. In addition it is going to be taking down its public API data that allows other sites, like RobinTrack.net, to source its data for visualization and analysis purposes.

"The data has been used to show booms in retail stocks," a CNBC report said on Friday. "You guys know RobinTrack well. A lot of financial news outlets use it for reporting, including CNBC."

Robinhood has said in a statement that even thought it is restricting third party access to its API data, it still has "many other tools" that its users can offer. 

"Trends and data are often misconstrued and misunderstood," Robinhood said. "The majority of its users" are buy and hold users, not daytraders, the brokerage said.

Yeah, right. Aside from the PR spin of trying to position itself as a serious brokerage and not a casino app for unemployed daytraders, we're guessing there is another angle to Robinhood removing this data: if you want it in the future, you're going to have to pay. 

For an alternative to Robinhood, see LevelX

Friday, August 7, 2020

Inequality Has Never Been Bigger: Financial Assets Hit A Record 620% Of GDP

 From Zero Hedge:

It was about a year ago when we showed a snapshot of the outrages wealth imbalance in the US with the help of just one metric: as of Aug 2019, Wall Street (US private sector financial assets) was 5.5x the size of Main Street (US GDP), and as BofA's Michael Hartnett pointed out, between 1950 & 2000 the norm was 2.5-3.5x. His conclusion, as recent events have sadly confirmed "Wall Street is now "too big to fail"."

Well fast forward one global pandemic and one unprecedented bailout later, which none other than Hartnett himself framed in the best possible way as follows...

"The monetary and the fiscal stimulus in terms of the announcements thus far, it comes to $20 trillion, $8 trillion of monetary stimulus and $12 trillion of fiscal stimulus. And that number is - it's a little over 20% of global GDP. So it's just astonishing and breathtaking and you have to sort of pinch yourself sometimes to sort of realize that it's actually happening."

... when in his latest Flows and Liquidity report, the BofA Chief Investment Officer provided an update on this most critical metric and it's a doozy.

Dubbing it the "Nihilistic Bull", Hartnett describes the current market as the consequence of a decade-long backdrop of Maximum Liquidity & Minimal Growth still Maximum Bullish, and more importantly, it has led to the value of US financial assets (Wall Street) now hitting an all time high 6.2X size of GDP (Main Street). In other words, not only is Wall Street now "even bigger to fail", but in its attempt to "fix" inequality, the Fed has made it greater than ever, and the now daily violence on America's streets is the most immediate consequence... if only those people protesting knew that they should target their anger not at the Capitol but the Marriner Eccles building.

Going back to the chart above, and the market that spawned it, Hartnett writes that "nothing matters but liquidity...GDP loss of $10tn & US claims 53mn numbed by $21tn policy stimulus, $2bn per hour central bank asset purchases." Furthermore, according to the BofA credit strategist, "the structural view on low yields now shared by all...doesn’t mean to say it is wrong...but it’s inciting a bubble" which is why Hartnett is now confident that the scramble into all asset will not end until the S&P is at 4000, gold $3000, and oil $60, all of which are "probably inconsistent with 0% Treasury yields."

And while not directly caused by it, it's worth recalling that the top 5 stocks are now a record 23% og the S&P500, surpassing dramatically the tech bubble peak:

And in the latest indication of just how long in the tooth the current bubble has become, BofA is now recycling the worst puns of 2018 and 2019, to wit:

I’m so bearish, I’m bullish: Minimal Growth = Maximum Liquidity = Maximum Bullish; narrative of 2010s hardens in 2020 as massive Wall St recovery coincides with Main St recession.

Meanwhile, as the market is stuck in the biggest bubble every, the economy is disintegrating, as banks refuse to lend (as discussed extensively here), while states can't spend, to wit:

Banks won’t lend: 71% of loan officers reported tighter bank lending standards in Q2, the tightest since Q4 ’08.


State & local governments can’t spend: state tax revenues down 37% YoY in New York, down 42% in California, down 53% in Oregon (Exhibit 1); US state & municipal shortfalls could be >$1tn worse-case in 2020 as no back-to-school, no back-to-office, no back-to-revenue.

All of this is of course happening as gold is exploding to daily all time highs as helicopter money is off the charts and deficits soaring: "U.S. federal budget deficit @ 25% of GDP if Phase IV fiscal stimulus >$1tn, highest since 1943 WWII peak of 27.5%."

Meanwhile, as even Goldman notes, the Dollar's reserve status is on borrowed time due to a tsunami of printing and debasing: as Hartnett writes, the US debt & deficits to be financed by:

  • Fed balance sheet (“Japanification” means higher UST holdings at Fed – Chart 5), and
  • Debasement of US dollar; big inflection points in US dollar always harbinger of leadership change (1971 = Stagflation, 1980 = Disinflation, 2001 = Globalization, 2020 = Inflation to solve Inequality).
  • What does all of this mean for markets? Three things - the "summer dip" Hartnett expected may not be coming after all, but 2020 will be the "big top ", and while 2020 is the megabull unleashed by central banks, 2021 will be the bear:
  • Summer dip: late-summer dip (SPX to 3050) thus far wrong but “air pocket” risk grows post +ve July payroll & Phase IV fiscal stimulus; Turkish lira at all-time low = 1st sign capital flow dislocations (as JPY approached 100); lower government yields bullish until credit spreads widen
  • Big top: 2020 risk asset peak most likely at time of vaccine, full capitulation by bears, higher interest rates; history of great bear market rallies predicts SPX 3300-3600 top between Aug-Jan; liquidity driving Wall St overshoots until weaker dollar/wider credit spreads signal credit event or fiscal stimulus/higher yields signal recovery.

His conclusion: "2020 = Bull; 2021 = Bearbigger government, smaller world, US dollar debasement...big picture themes of 2021...buy volatility & inflation assets." 

Translation: buy vix, buy gold.