Renko bars form based on the order of incoming ticks to create specific box sizes. Say, for example, that a trader creates a box size of 5 pips. If the price rises 5 pips from the close price of the last Renko bar, then the chart creates a new bar 5 pips tall. Every 5 pip increment, whether up or down, draws a new Renko bar.
Using increments that easily fall within normal market gaps creates the false impression of trade-able prices where none existed. Minor news events frequently result in 5-10 pip market gaps. In the case of the 10 pip gap, a box size of 5 pips creates 2 Renko bars. The two bars do nothing to communicate the fact that the prices never existed. Their presence merely indicates the direction of a move and eliminates the idea of time altogether. Time, or more specifically the absence of it, strikes me as rather important.
Small box sizes more commonly lead to questions about wildly inaccurate backtests. I received two questions last week inquiring why NinjaTrader showed $19,000 returns in a backtest, but the same forward test lost nearly an identical amount.
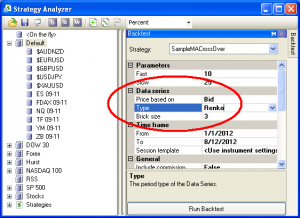
The backtests rely on a selected data set to generate the Renko bars used for testing. Users nearly always overlook the data source option in NinjaTrader. It defaults to one minute charts. One tick bid is the only type of data that will form perfectly accurate charts. Any other increment risks creating Renko bars that never existed.
Take an extreme example of one minute chart data drawing Renko bars with a 3 pip box size. Say that the over-all height of the bar is 10 pips, the low is 1 pip from the open and the M1 bar closes 8 pips higher. How many Renko boxes does the chart need to draw? The correct answer is that there is no way of knowing.
Examples:
- The market goes down 1 pip, then up 10 pips and settles at the close price. This draws 3 total box with one box in progress.
- The market goes down 1 pip, then up 3 pips, then down 3 pips, then up 10 pips. This draws 5 boxes total with one box in progress.
- The market does down 1 pip, then up 3 pips, then down 3 pips, then up 3 pips, then down 3 pips, then up 10 pips. This draws 7 boxes total with one box in progress.
It's done in good faith, but NinjaTrader is essentially making up Renko data to cover up gaps in the price data. When you're running a backtest, the whole point of the exercise is to eliminate guessing and deliver solid answers.
Most people make the hand waving assumption that it all averages out in the end. The two clients asking me this week about why their Renko backtests came out so screwy, and the reason that I'm writing this post, is that the hypothetical versus real performance was as different as night from day. It most certainly does not average out. Rather, it introduces so many errant points as to make the tests worthless.
Don't make assumptions in your backtest. Get tick data and, if you're using Renko bars, make sure to set the test up properly.
