Thursday, July 2, 2020

National Coin Shortage Shines Light On Worthless Penny

A shortage of coins is appearing across America due to the covid‐19 pandemic significantly disrupting the supply chain and normal circulation patterns for U.S. coins. The U.S. Mint halted production due to covid-19 which has caused Fed Chair Powell to admit to lawmakers the Fed will be rationing coins until the problem is resolved. Powell said; "What's happened is that with the partial closure of the economy, the flow of coins through the economy ... it's kind of stopped." He went on to say the shortage which is expected to be temporary is due to the business closures that prevented people from spending their coins, as well as a lack of places that are open where people can trade coins for paper bills.
We can only hope that this will cause more people to question the usefulness of the penny which is a blemish on the face of America. It is costly to produce, no friend to the environment and it wastes America’s resources while sapping our productivity. It cost our country billions of dollars, year after year. According to the “citizens to retire the penny” it cost the Country one hundred million dollars a year to produce the penny, and more then $15 billion dollars annually is wasted just in handling it. Coins are designed by the government to be a simple and efficient medium for the exchange of goods and services. For many years there have been discussions about discontinuing the penny which has become obsolete because of its minuscule purchasing value. The penny is a perfect example of our government's inefficiency and waste, and the cost is a burden carried by business. If an employee is paid $12.00 an hour they receive twenty cents per minute. Businesses simply cannot afford to pay an employee to handle and count pennies, the cost of the labor exceeds their value.
Pennies Make A Great Bathroom Floor
In March of 2012 Canada made the decision to do away with its puny penny coin, loved by some but an annoyance to many, it was withdrawn from circulation because it costs too much to make and had become a pecuniary pest. Ottawa said the penny retained only one-twentieth of its original purchasing power. Because it costs 1.6 cents to produce each one-cent coin stamped out, discontinuing the penny was expected to save around $11 million a year.
"It was just one of those no-brainer slam dunks. It's a place where we can save money," said legislator Pat Martin, who has long campaigned for the penny to be abolished. In the middle of 2014 the Toronto Sun reported that since circulation of the penny was discontinued on Feb. 4, 2013, more than four billion of the copper coins had been recovered, equivalent to a face value of approximately $40 million. The Royal Canadian Mint at the time estimated that approximately 6 billion pennies were in circulation when production of the coin ceased in 2012. I suspect the number has dropped substantially since then and its use has become non-existent. Once the distribution of the coin ceased vendors were no longer expected to return pennies as change for cash purchases and were encouraged to round purchases to the nearest five cents.
As for the issue of the American penny, simply put, the American penny doesn't make sense! Let it be decreed that the penny when weighed and measured is found lacking. Other nations have either ceased to produce or have removed low denomination coins the list includes Australia, Brazil, Finland, Israel, the Netherlands, New Zealand, Norway, Sweden, Switzerland, Britain, and as stated above Canada. By the time it was discontinued many Canadians considered the penny more of a nuisance than a useful coin. They often stored them in jars, threw them away in water fountains, or refuse them as change. Financial institutions faced increasing costs for handling, storing, and transporting pennies, and over time the penny had become a burden to the economy.
The Penny No Longer Makes Sense
To many people the penny is simply a horrible little thing with no redeeming value that destroys vacuum cleaners when they accidentally suck one up.  Still, we find that not only does the government continue making the penny but over the years it has even made new versions of the penny. Voters need to remind Washington that it is not the job of the well-paid employees of the treasury to create collectibles or to pander to small segments of the population by designing coins commemorating or recognizing minor events.
The debate against continuing the penny is overwhelming, anyone still supporting it most likely has not given the subject much thought or is simply resistant to change, “the penny doesn't make sense".  From an environmental standpoint, the penny is also a disaster when you consider all the energy used to make, transport, and distribute this useless coin. Currently, it costs the U.S. Mint 1.66 cents to make each one-cent coin, meaning that taxpayers are losing 0.66 of a cent for each one of the 9.1 billion pennies the Mint produces each year. That is a loss of $60,181,440 to produce pennies in 2016. The U.S. Mint makes an average of  21 million pennies per day which adds up to around nine billion pennies annually. If we just get rid of the penny, the U.S. Mint would cut its work in half. This figure does not include the time, fuel, expense, and hassle of carting all of those pennies around to the banks, merchants, etc.
If we stop making pennies we would also save all this cost associated with it. Remember the penny coin, has almost no purchasing power today and the cost of making the pennies is higher than face value. The melt value of pennies ranges from more than two cents for the pre-1982 copper pennies, to nearly a full cent for the zinc pennies. Logically, sooner or later the penny is destined to the dustbin of history. Ditching the penny would cost literally nothing and with a flourish of the executive pen create huge annual savings for business but such a move remains fiercely opposed by metal alloy industries and Coinstar, which makes millions each year by helping people get rid of their unwanted change.
According to the folks at RetireThePenny.org, the average American wastes 2.4 hours a year handling pennies or waiting for people who handle them. This statistic is the result of compiling several penny-handling related events. These events include the ubiquitous 30 second period we sometimes spend waiting for someone who has to dig through their pockets or purse to find that last cent so they can pay for something with exact change. They probably do this, so they don't get stuck with any more pennies. Still, we should not expect the government to take action anytime soon in our country so focused on pandering to those who fear change. It seems we may need some kind of push to bring about the penny’s final demise, because if we wait for those in charge of such things to do the logical thing we may be waiting until the end of time. Small things matter, if our politicians can’t get this right how can they ever deal with the more important issues facing our nation?

Stunning Surge In New CMBS Delinquencies Heralds Commercial Real Estate Disaster

From Zero Hedge:

Two months ago, we thought that the unprecedented implosion in US commercial real estate in the month of April following the near-uniform economic shutdown following the coronavius pandemic, manifesting in the surge in newly delinquent CMBS loans would be one for the ages, even though as we predicted May would likely be worse as a result of the spike in specially services loans. 
And indeed while April was ugly, May was even worse. But both pale in comparison to what the latest June remittance data.
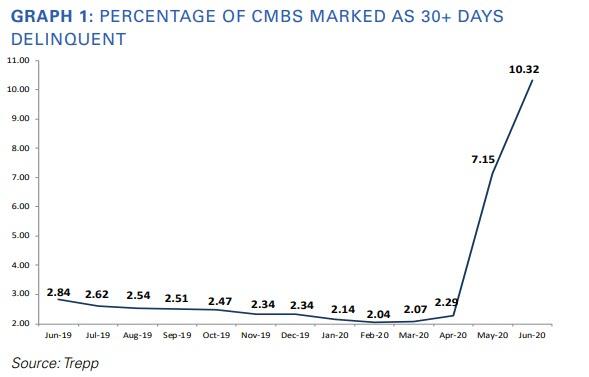
First, the good news: as Trepp writes in its latest monthly CMBS remittance report, at one point in June, it appeared that a new all-time high for CMBS delinquencies would be reached. However, when the final numbers were posted, the 2012 high of 10.34%, a fraction higher than the current level, remains the peak for the time being.
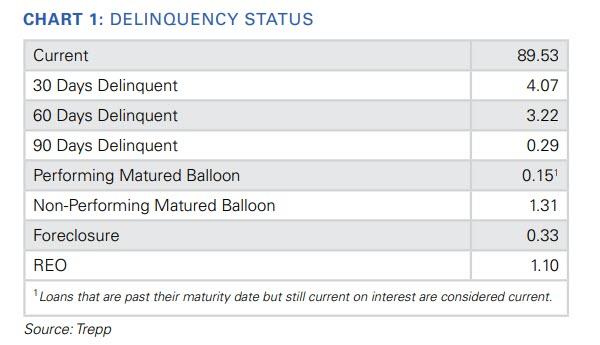
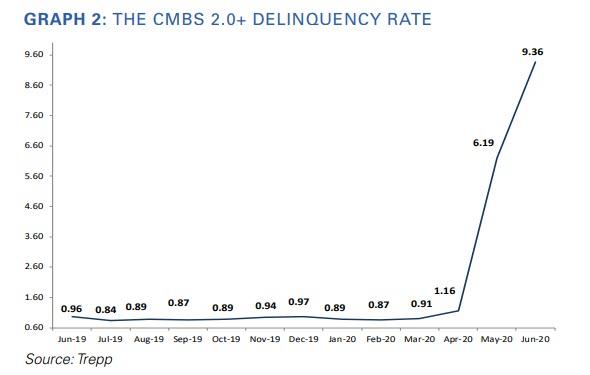
Next, the not so good news: the latest, June, Trepp CMBS Delinquency Rate was 10.32%, a jump of 317 basis points over the May number. About 5% of that number represents loans in the 30 days delinquent bucket while another 3.2% are now 60 days delinquent. And while the 2012 high remains the record for now, it won't be for long, as the numbers are headed still higher in July.
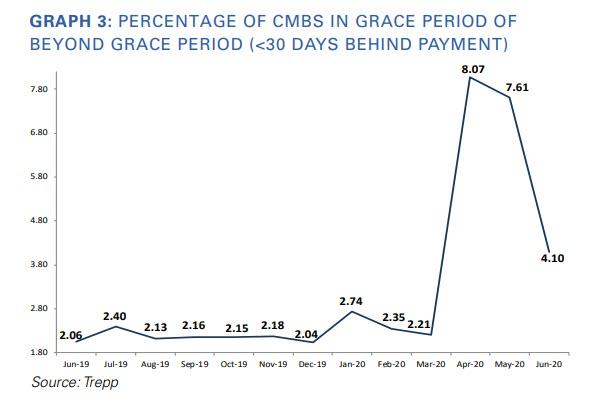
That’s because 4.1% of loans by balance missed the June payment but remained less than 30 days delinquent.  That percentage of loans in or beyond grace period (the A/B loans) has fallen from 8.1% in April and 7.6% in May.
An optimistic take on the data is that perhaps we have reached terminal delinquency velocity – meaning most of the borrowers that felt the need for debt service relief have requested it. (Put another way, if a borrower didn’t need relief in April, May, or June there is a good chance the borrower won’t be needing it), although maturity defaults could still be an issue.) If that is the case, the expectation would be that the increases in the delinquency rate going forward should be smaller than what we saw in May and June. Alternatively, if the fiscal cliff hits at the end of July without a replacement stimulus, expect a second wave - if not of virus infections - then certainly of new commercial real estate delinquencies.

Some other overall statistics:
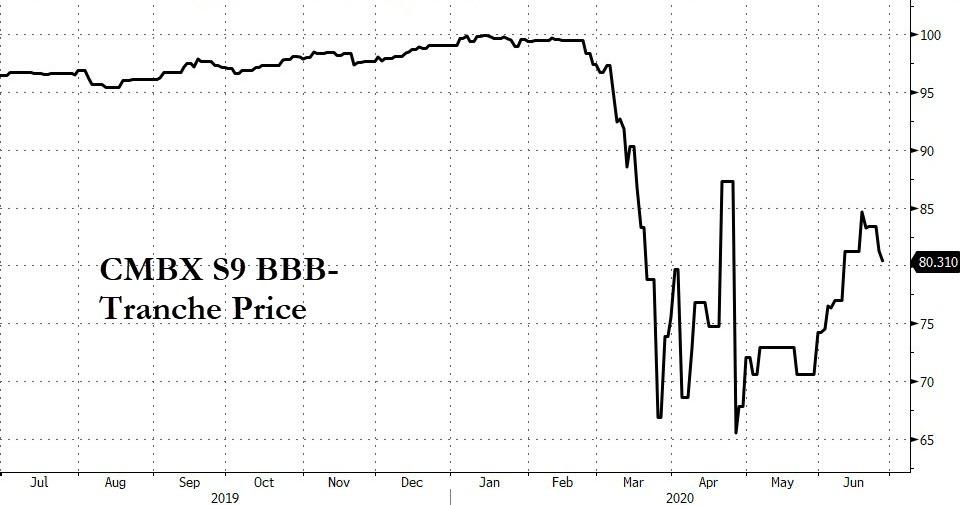
The percentage of loans with the special servicer grew from 6.07% in May to 8.28% in June. According to June servicer data, 20.5% of all lodging loans were in special servicing, up from 16.2% in May, which is why some have suggested that the next Big Short in CRE will be the CMBX Series 9 which is especially heavy on hotel loans.
2020-06-27
In addition, 14.3% of retail loans are with the special servicer, up from 9.3%.
The Overall Numbers
  • The overall US CMBS delinquency rate climbed 317 basis points in June to10.32%. (The all-time high on this basis was 10.34% registered in July 2012.)
  • The % ofA/B loans (i.e. loans in grace period or beyond grace period) was 4.1% in June.
  • Year over year, the overall US CMBS delinquency rate is up 748 basis points.
  • The percentage of loans that are seriously delinquent (60+ days delinquent, in foreclosure, REO, or non-performing balloons) is now 6.25%, up 408basis points for the month.
  • If defeased loans were taken out of the equation, the overall 30-day delinquency rate would be 10.88%, up 332 basis points from May.
  • One year ago, the US CMBS delinquency rate was 2.84%.
  • Six months ago, the US CMBS delinquency rate was 2.34%.
The CMBS 2.0+ Numbers
  • The CMBS 2.0+ delinquency rate jumped 317 basis points to 9.36% in June. The rate is up 840 basis points year over year.
  • The percentage of CMBS 2.0+ loans that are seriously delinquent is now 5.27%, which is up 417 basis points from May.
  • If defeased loans were taken out of the equation, the overall CMBS 2.0+ delinquency rate would be 9.85%, up 331 basis points for the month.

Overall Property Type Analysis (CMBS 1.0 and 2.0+)
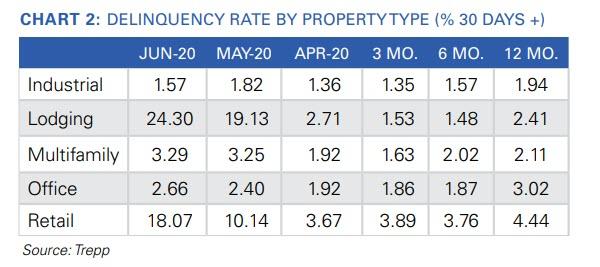
  • The industrial delinquency rate fell 25 basis points to 1.57%.
  • The amount of industrial loans categorized as A/B in June: 1.55%.
  • The lodging delinquency rate jumped 517 basis points to 24.3%.
  • The amount of lodging loans categorized as A/B in June: 7.91%.
  • The multifamily delinquency rate rose four basis points to 3.29%.
  • The amount of multifamily loans categorized as A/B in June: 1.45%.
  • The office delinquency rate moved up 26 basis points to 2.66%.
  • The amount of office loans categorized as A/B in June: 1.92 %
  • The retail delinquency rate spiked 793 basis points to 18.07%.
  • The amount of retail loans categorized as A/B in June: 5.42%.
Property Type Analysis CMBS 2.0+:
  • Industrial delinquency rate: 0.67% (down 24 basis points month over month)
  • Lodging delinquency rate: 24.11% (up 522 basis points)
  • Multifamily delinquency rate: 3.24% (up 14 basis points)
  • Office delinquency rate: 1.29% (up 16 basis points)
  • Retail delinquency rate: 16.07% (up 788 basis points)
Property Type Analysis CMBS 1.0:
  • Industrial delinquency rate: 43.35% (up 29 basis points month over month)
  • Lodging delinquency rate: 40.76% (up 31 basis points)
  • Multifamily delinquency rate: 11.71% (down 678 basis points)
  • Office delinquency rate: 38.56% (up 328 basis points)
  • Retail delinquency rate: 78.02% (up 1179 basis points)

    "Great Job Numbers" Trump Booms As Payrolls Soar By Record 4.8 Million, Crushing Expectations

    From Zero Hedge:

    In our preview of today's job's report, we remarked that the only thing that was certain about the June payrolls number is just how uncertain it was: dropping the top and bottom 10% of payrolls forecasts still leaves a range of 1.65-5.00 million jobs, "an extremely wide band that reflects the multiplicity of shocks hitting US labor markets", according to Steven Englander. Art Cashin echoed just how much confusion there was by noting that "most traders are somewhat sceptical of all payroll data, feeling that the sharp reopenings and then reopening rollbacks have distorted the data."
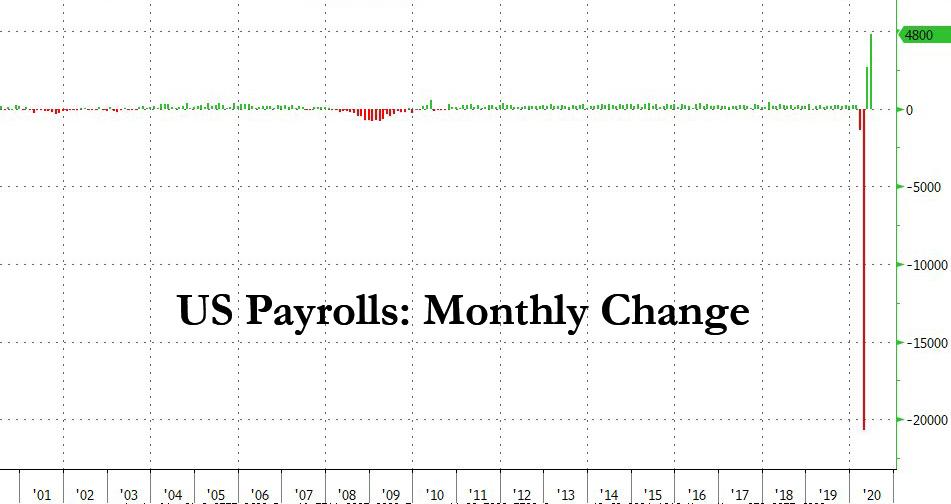
    So with much confusion out there, and nobody really sure what to expect, moments ago the BLS reported that in keeping with the huge band of possibilities, in June the US economy added a whopping - record - 4.767 million jobs, crushing expectations of 3.058 million, and indicating that the V-shaped recovery, if only in the BLS' servers, is well on track.
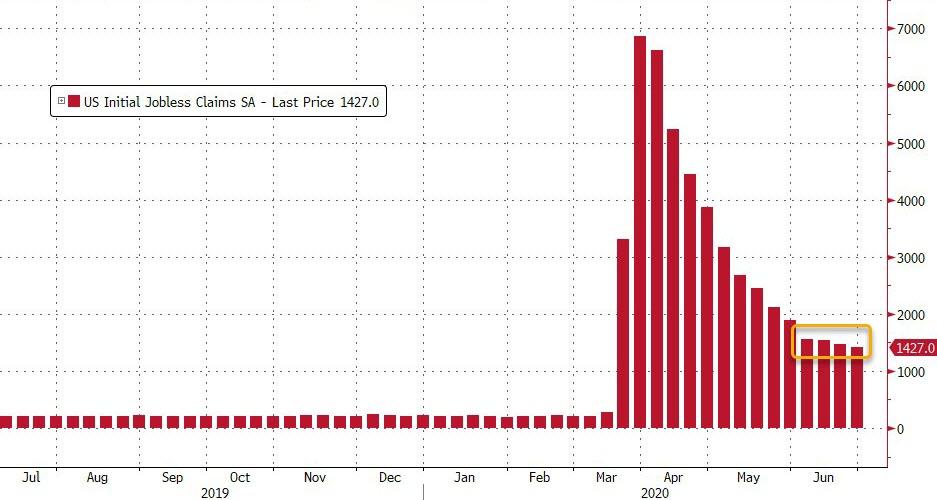
    Somewhat paradoxically, the massive beat took place even as we got another week of initial claims missing, with the latest print of 1.427MM above the 1.35MM expected, while continuing claims of 19.29MM was also above the 19.0MM expected.
    The change in total nonfarm payroll employment for April was revised down by 100,000, from -20.7 million to -20.8 million, and the change for May was revised up by 190,000, from +2.5 million to +2.7 million. With these revisions, employment in April and May combined was 90,000 higher than previously reported.
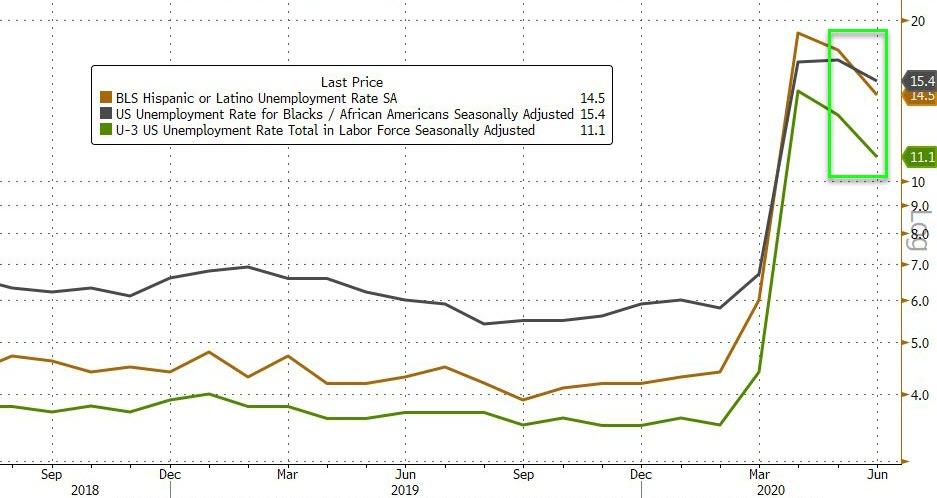
    Just as shocking is that the unemployment rate which was expected to surge to a record 19.1% in May from 14.7% in April, actually declined in May to 13.3% and dropped further to 11.1% in June, far better than the 12.5% expected. Both Hispanic and Black unemployment rates dropped.
    Commenting on the number, the BLS said that "total nonfarm payroll employment rose by 4.8 million in June, and the  unemployment rate declined to 11.1 percent. These improvements in the labor market reflected the continued resumption of economic activity that had been curtailed in March and April due to the coronavirus (COVID-19) pandemic and efforts to contain it. In June, employment in leisure and hospitality rose sharply. Notable job gains also occurred in retail trade, education and health services, other services, manufacturing, and professional and business services."
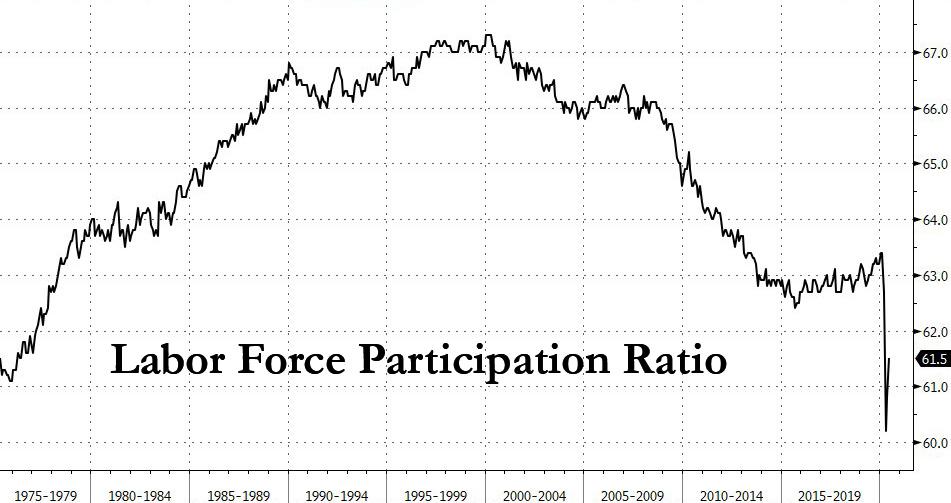
    Total employment, as measured by the household survey, rose by 4.9 million to 142.2 million in June. The employment-population ratio, at 54.6 percent, rose by 1.8 percentage points over the month but is 6.5 percentage points lower than in February. The labor force participation rate increased by 0.7% in June to 61.5%, but is 1.9% points below its February level.
    The number of persons employed part time for economic reasons declined by 1.6 million to 9.1 million in June but is still more than double its February level. These individuals, who would have preferred full-time employment, were working part time because their hours had been reduced or they were unable to find full-time jobs. This group includes persons who usually work full time and persons who usually work part time.
    The number of persons not in the labor force who currently want a job, at 8.2 million, declined by 767,000 in June but remained 3.2 million higher than in February. These individuals were not counted as unemployed because they were not actively looking for work during the last 4 weeks or were unavailable to take a job.
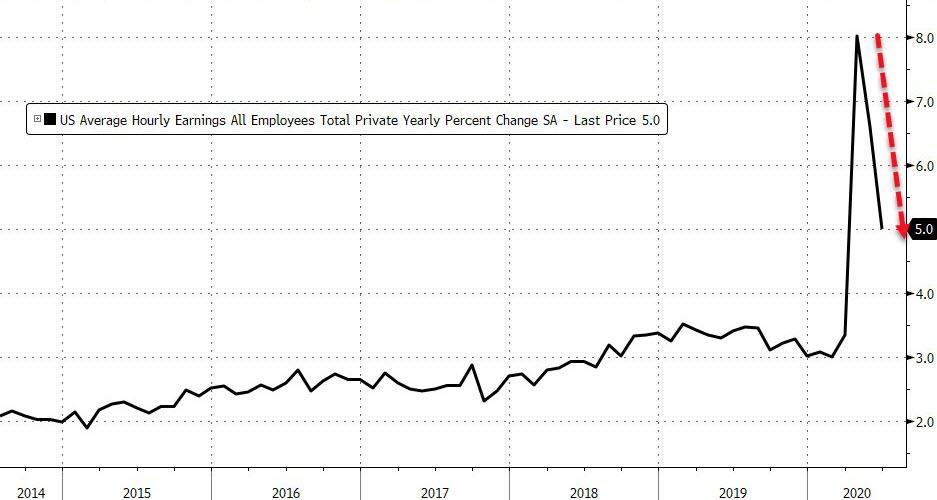
    Continuing last month's trend, the average hourly earnings dropped from April's revised 8.0% to 6.7% in May and to 5.0% in June, below the expected 5.3% print.
    According to the BLS, average hourly earnings for all employees fell by 35 cents to $29.37. Average hourly earnings of private-sector production and nonsupervisory employees decreased by 23 cents to $24.74 in June. The decreases in average hourly earnings largely reflect job gains among lower-paid workers; these changes put downward pressure on the average hourly earnings estimates. So how did average hourly earnings rise? Simple: the average workweek for all employees - i.e., the denominator - decreased even more, or by 0.2 hour to 34.5 hours in June, while the average workweek for production and nonsupervisory employees on private nonfarm payrolls fell by 0.2 hour to 33.9 hours. That said, even the BLS admitted that the recent employment changes, especially in industries with shorter workweeks, "complicate monthly comparisons of the average weekly hours estimates."
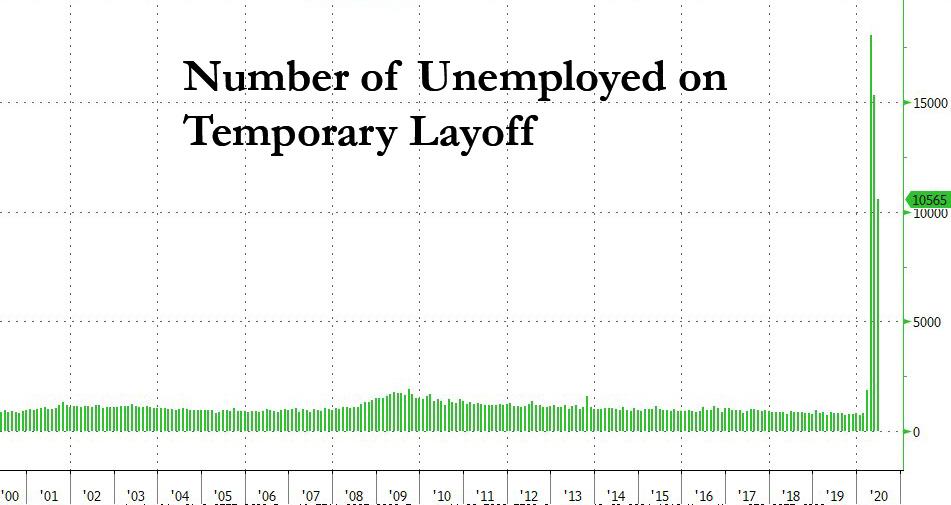
    Today's report also noted that the number of unemployed persons who were on temporary layoff decreased by nearly 5 million, to 10.565 million from 15.3 million, a second consecutive decline from 18.1 million in April. Among those not on temporary layoff, the number of permanent job losers continued to rise, increasing by 295,000 in May to 2.3 million.
    And one red flagaccording to the BLS, the number of permanent job losers continued to rise, increasing by 588,000 to 2.9 million in June. The number of unemployed reentrants to the labor force rose by 711,000 to 2.4 million.
    Also in June, the number of unemployed persons who were jobless less than 5 weeks declined by 1.0 million to 2.8 million.  Unemployed persons who were jobless 5 to 14 weeks numbered 11.5 million, down by 3.3 million over the month, and accounted for 65.2 percent of the unemployed. By contrast, the number of persons jobless 15 to 26 weeks  and the long-term unemployed (those jobless for 27 weeks or more) saw over-the-month increases (+825,000 to 1.9 million and +227,000 to 1.4 million, respectively).
    Looking at a breakdown by industry:
    • Employment in leisure and hospitality increased by 2.1 million, accounting for about two-fifths of the gain in total nonfarm employment. Over the month, employment in food services and drinking places rose by 1.5 million, following a gain of the same magnitude in May. Despite these gains, employment in food services and drinking places is down by 3.1 million since February. Employment also rose in June in amusements, gambling, and recreation (+353,000) and in the accommodation industry (+239,000).
    • Employment in retail trade rose by 740,000, after a gain of 372,000 in May and losses totaling 2.4 million in March and April combined. On net, employment in the industry is 1.3 million lower than in February. In June, notable job gains occurred in clothing and clothing accessories stores (+202,000), general merchandise stores (+108,000), furniture and home furnishings stores (+84,000), and motor vehicle and parts dealers (+84,000).
    • Employment increased by 568,000 in education and health services in June but is 1.8 million below February's level. Health care employment increased by 358,000 over the month, with gains in offices of dentists (+190,000), offices of physicians (+80,000), and offices of other health practitioners (+48,000). Elsewhere in health care, job losses continued in nursing care facilities (-18,000). Employment increased in the social assistance industry (+117,000), reflecting gains in child day care services (+80,000) and in individual and family services (+28,000). Employment in private education rose by 93,000 over the month.
    • Employment increased in the other services industry in June (+357,000), with about three-fourths of the increase occurring in personal and laundry services (+264,000). Since February, employment in the other services industry is down by 752,000.
    • In June, manufacturing employment rose by 356,000 but is down by 757,000 since February. June employment increases were concentrated in the durable goods component, with motor vehicles and parts (+196,000) accounting for over half of the job gain in manufacturing. Employment also increased over the month in miscellaneous durable goods manufacturing (+26,000) and machinery (+18,000). Within the nondurable goods component, the largest job gain occurred in plastics and rubber products (+22,000).
    • Professional and business services added 306,000 jobs in June, but employment is 1.8 million below its February level. In June, employment rose in temporary help services (+149,000), services to buildings and dwellings (+53,000), and accounting and bookkeeping services (+18,000). By contrast, employment declined in computer systems design and related services (-20,000).
    • Construction employment increased by 158,000 in June, following a gain of 453,000 in May. These gains accounted for more than half of the decline in March and April (-1.1 million combined). Over-the-month gains occurred in specialty trade contractors (+135,000), with growth about equally split between the residential and nonresidential components. Job gains also occurred in construction of buildings (+32,000).
    • Transportation and warehousing added 99,000 jobs in June, following declines in the prior 2 months (-588,000 in April and May combined). In June, employment rose in warehousing and storage (+61,000), couriers and messengers (+21,000), truck transportation (+8,000), and support activities for transportation (+7,000).
    • Wholesale trade employment rose by 68,000 in June but is down by 317,000 since February. In June, job gains occurred in the durable goods (+39,000) and nondurable goods (+27,000) components.  
    • Financial activities added 32,000 jobs in June, with over half of the gain in real estate (+18,000). Since February, employment in financial activities is down by 237,000.
    • Government employment changed little in June (+33,000), as job gains in local government education (+70,000) were partially offset by job losses in state government (-25,000). Government employment is 1.5 million below its February level.
    • Mining continued to lose jobs in June (-10,000), with most of the decline occurring in support activities for mining (-7,000). Mining employment is down by 123,000 since a recent peak in January 2019, although nearly three-fourths of the decline has occurred since February 2020.
    * * *
    How "political" was today's report? We will leave it to readers to decide especially when moments after the report Trump, who knew the numbers yesterday, praised the "Great Job Numbers" and held a press conference at 930am for a victory lap. That said, it was a modest downgrade from last month's Trump Tweet that "THESE NUMBERS ARE INCREDIBLE."
    So does this record jobs report, the second in a row, mean the Fed has to hike soon? Yeah, right.