Two months ago, we thought that the unprecedented implosion in US commercial real estate in the month of April following the near-uniform economic shutdown following the coronavius pandemic, manifesting in the surge in newly delinquent CMBS loans would be one for the ages, even though as we predicted May would likely be worse as a result of the spike in specially services loans.
And indeed while April was ugly, May was even worse. But both pale in comparison to what the latest June remittance data.
First, the good news: as Trepp writes in its latest monthly CMBS remittance report, at one point in June, it appeared that a new all-time high for CMBS delinquencies would be reached. However, when the final numbers were posted, the 2012 high of 10.34%, a fraction higher than the current level, remains the peak for the time being.
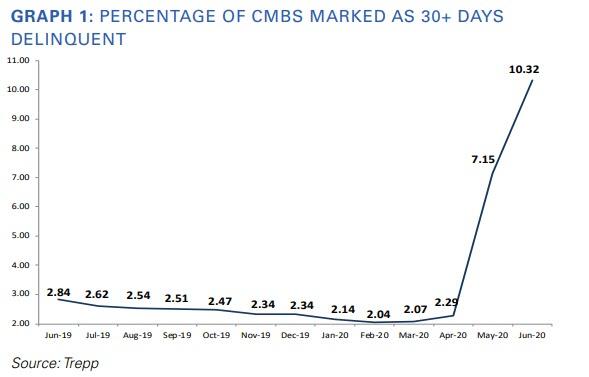
Next, the not so good news: the latest, June, Trepp CMBS Delinquency Rate was 10.32%, a jump of 317 basis points over the May number. About 5% of that number represents loans in the 30 days delinquent bucket while another 3.2% are now 60 days delinquent. And while the 2012 high remains the record for now, it won't be for long, as the numbers are headed still higher in July.

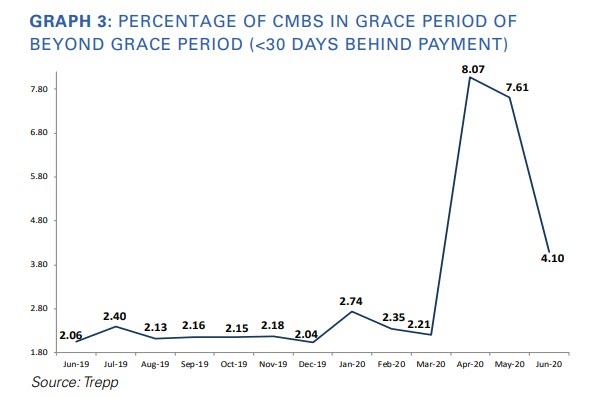
That’s because 4.1% of loans by balance missed the June payment but remained less than 30 days delinquent. That percentage of loans in or beyond grace period (the A/B loans) has fallen from 8.1% in April and 7.6% in May.
An optimistic take on the data is that perhaps we have reached terminal delinquency velocity – meaning most of the borrowers that felt the need for debt service relief have requested it. (Put another way, if a borrower didn’t need relief in April, May, or June there is a good chance the borrower won’t be needing it), although maturity defaults could still be an issue.) If that is the case, the expectation would be that the increases in the delinquency rate going forward should be smaller than what we saw in May and June. Alternatively, if the fiscal cliff hits at the end of July without a replacement stimulus, expect a second wave - if not of virus infections - then certainly of new commercial real estate delinquencies.
Some other overall statistics:
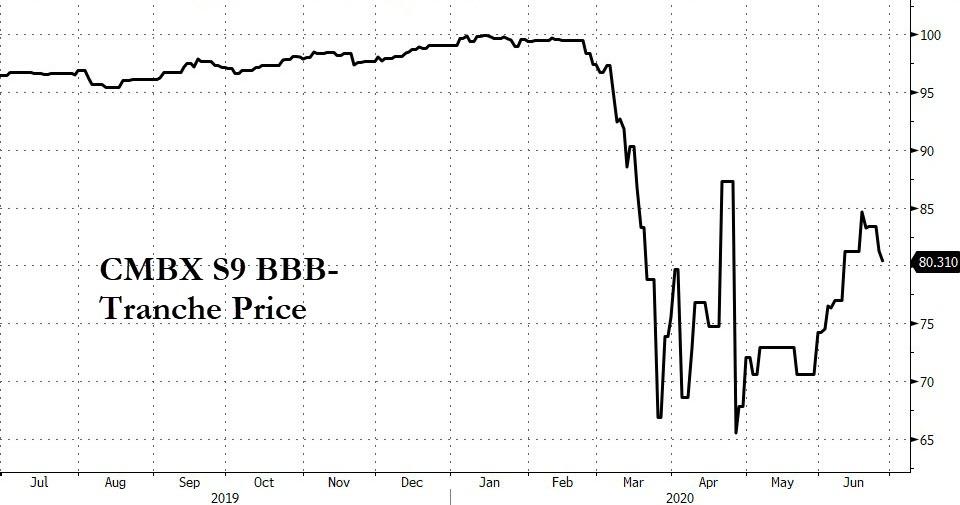
The percentage of loans with the special servicer grew from 6.07% in May to 8.28% in June. According to June servicer data, 20.5% of all lodging loans were in special servicing, up from 16.2% in May, which is why some have suggested that the next Big Short in CRE will be the CMBX Series 9 which is especially heavy on hotel loans.
In addition, 14.3% of retail loans are with the special servicer, up from 9.3%.
The Overall Numbers
- The overall US CMBS delinquency rate climbed 317 basis points in June to10.32%. (The all-time high on this basis was 10.34% registered in July 2012.)
- The % ofA/B loans (i.e. loans in grace period or beyond grace period) was 4.1% in June.
- Year over year, the overall US CMBS delinquency rate is up 748 basis points.
- The percentage of loans that are seriously delinquent (60+ days delinquent, in foreclosure, REO, or non-performing balloons) is now 6.25%, up 408basis points for the month.
- If defeased loans were taken out of the equation, the overall 30-day delinquency rate would be 10.88%, up 332 basis points from May.
- One year ago, the US CMBS delinquency rate was 2.84%.
- Six months ago, the US CMBS delinquency rate was 2.34%.
The CMBS 2.0+ Numbers
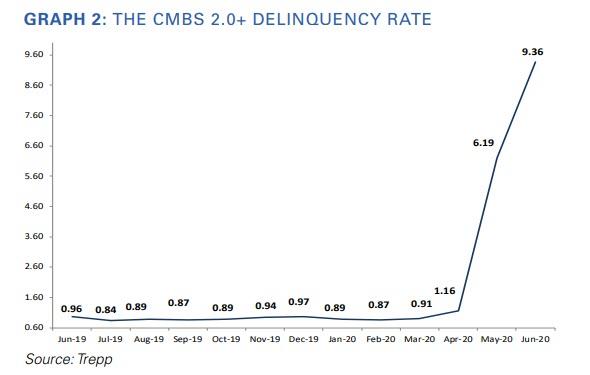
- The CMBS 2.0+ delinquency rate jumped 317 basis points to 9.36% in June. The rate is up 840 basis points year over year.
- The percentage of CMBS 2.0+ loans that are seriously delinquent is now 5.27%, which is up 417 basis points from May.
- If defeased loans were taken out of the equation, the overall CMBS 2.0+ delinquency rate would be 9.85%, up 331 basis points for the month.
Overall Property Type Analysis (CMBS 1.0 and 2.0+)
- The industrial delinquency rate fell 25 basis points to 1.57%.
- The amount of industrial loans categorized as A/B in June: 1.55%.
- The lodging delinquency rate jumped 517 basis points to 24.3%.
- The amount of lodging loans categorized as A/B in June: 7.91%.
- The multifamily delinquency rate rose four basis points to 3.29%.
- The amount of multifamily loans categorized as A/B in June: 1.45%.
- The office delinquency rate moved up 26 basis points to 2.66%.
- The amount of office loans categorized as A/B in June: 1.92 %
- The retail delinquency rate spiked 793 basis points to 18.07%.
- The amount of retail loans categorized as A/B in June: 5.42%.
Property Type Analysis CMBS 2.0+:
- Industrial delinquency rate: 0.67% (down 24 basis points month over month)
- Lodging delinquency rate: 24.11% (up 522 basis points)
- Multifamily delinquency rate: 3.24% (up 14 basis points)
- Office delinquency rate: 1.29% (up 16 basis points)
- Retail delinquency rate: 16.07% (up 788 basis points)
Property Type Analysis CMBS 1.0:
- Industrial delinquency rate: 43.35% (up 29 basis points month over month)
- Lodging delinquency rate: 40.76% (up 31 basis points)
- Multifamily delinquency rate: 11.71% (down 678 basis points)
- Office delinquency rate: 38.56% (up 328 basis points)
- Retail delinquency rate: 78.02% (up 1179 basis points)
