I got the idea for a trailing limit from Van Tharpe's market classic Trade Your Way to Financial Freedom. I had Jon Rackley read through the book as part of his training when I first hired him. He brought my attention to an abnormal claim made in the middle of the book. Van Tharpe says that it's repeatedly possible to make money even with random numbers.
The book states that trading with totally random entries and a 3 ATR trailing stop regularly leads to making profits. Flip a coin. You buy if it lands on heads. Go short if it lands on tails. One important note is that we elected to incorporate pure random numbers in our programming instead of the pseudo-random numbers that coding languages generate. Doing this allows us to avoid time biases in the seeding process that repeatedly pop up when the seeds applied are close together in time.
Random numbers are a hobby of mine. I've continuously put effort into figuring out whether I could develop a strategy that trades totally at random and still makes profits. As the owner of a programming company for traders, and as part of Jon's early training for NinjaTrader in December, I assigned him the task of programming the blueprint into code.
The first functioning version that I inspected exhibited everything contrary to Van Tharpe's assertions. Using a trailing stop, regardless of the instrument and period tested, inevitably led to devastating losses. The profit factors usually came in near 0.7, a truly terrible number.
We did what most of our clients do when they find abysmal strategies. We flipped the strategy on its head. The new strategy uses only a 3 ATR (50 period) trailing limit.
Trailing Limit Analysis
The early conclusion is that trailing limits appear to offer a great deal of potential. Although Jon sent me the code several months ago, it's only this evening that I had a chance to properly review and test everything.
The profit factors are very encouraging. It depends on the chart that I tested. The worst that I found was a 1.0 profit factor. Everything else came out with profit factors greater than 1. The small table below contains the initial test results. Before you go off salivating that this is the next hot winner, there are a few considerations to keep in mind:
- The results depend entirely on the sequence of random numbers used. Using different sets of random numbers will cause different outcomes.
- The better results on the higher time frames likely result from sampling error. The number of trades involved was only ~160, which is not enough to make definitive conclusions on the nature of the performance. I prefer to see 400 or more trades before drawing definitive conclusions.
- These results do not include spread costs or commissions.
| Currency | Period | Profit Factor | Dates Tested |
| EURUSD | M1 | 1.12 | 9/12/2011-3/12/2012 |
| GBPUSD | M1 | 1.16 | 9/12/2011-3/12/2012 |
| USDJPY | M1 | 1.25 | 9/12/2011-3/12/2012 |
| EURUSD | M5 | 1.11 | 2011 |
| GBPUSD | M5 | 1.0 | 2011 |
| USDJPY | M5 | 1.06 | 2011 |
| EURUSD | H1 | 1.26 | 2011 |
| GBPUSD | H1 | 1.25 | 2011 |
| USDJPY | H1 | 1.48 | 2011 |
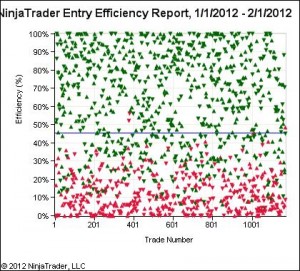
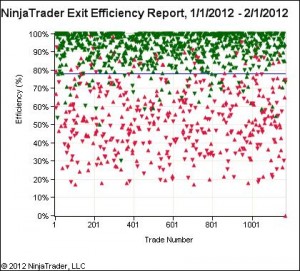
What made me feel better about the results was reviewing the entry and exit efficiencies of each strategy. The number of trades involved really cluttered the graphic. I ran a backtest on a much shorter time period so that the horizontal, blue line would appear clearly on each graph.
 |  |
The entry efficiency tells us exactly what we would expect to find. Trades which enter at random do not produce better than random (obviously). What's fascinating is how the trailing limit exit strategy actually skews the entry efficiencies to read slightly worse than random. This is a good example of why it's hazardous to rely purely on statistics. Keeping the big picture in mind minimizes the likelihood of making an erroneous conclusion, in this case that there might be something "wrong" with our absolutely random entries.
Adding Money Management
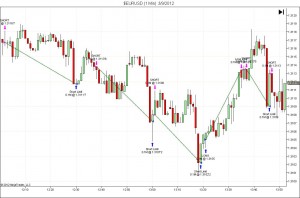
The percentage of winners for the tested charts ranges from 60-67% accuracy. High percentages of winners generally lead to winning streaks. My cursory glance through the chart led to my easily finding a suitable example to cherry pick. Here, 5 trades consecutively reach their near maximum limit orders.
Testing that I've done in the past tells me that it's frequently advantageous to increase the position size based on consecutive winners when a strategy is more than 50% accurate. My first idea after studying the initial results was to modify the forex money management strategy to pursue the consecutive winners.
While increasing the risk after consecutive winners works out statistically in your favor, it does add to the risk. It's entirely likely for a "winning" set of trades to start losing based solely on the money management strategy. There's no way to know whether your set of trades will be the lucky beneficiary of the extra risk or whether it will be the unlikely loser.