The 20th century’s ‘Great Equalisation’ of wealth in Europe and the US was the result of the decline of top wealth shares. In England, the wealth share of the top 1% transformed from over 75% in 1900 to less than 20% by 1970. Economists believe that new wealth created by the post-war ‘Golden Age’ of economic growth grew faster than old wealth, accumulating at the net-of-taxes rate of return (Piketty 2014).
This stylised fact is based primarily upon declared wealth. But the incentive to hide wealth exploded over the 20th century. In 1950s Great Britain, the top marginal rate of estate tax was almost 80%.
Is the ‘Great Equalisation’ of wealth illusory? A simple misreading of the true wealth distribution, a result of an increased tendency of elites to hide their riches?
Declared wealth-at-death data are the primary source for our understanding of the 20th century wealth distribution in England (Atkinson and Harrison 1978, Atkinson et al. 1989, Atkinson 2018, Alvaredo et al. 2018). Since 1858, the individual details of wealth at death have been centrally recorded in the Principal Probate Registry calendars. This source records all decedents in England and Wales with wealth above the threshold (currently £5,000). Name, address, date of death, the name of the executor and an estimate of estate value were consistently recorded. I digitised the original printed volumes and algorithmically parsed and formed them into a database suitable for economic analysis, in a process which I describe in Cummins (2019a).
Using this 100% sample over the period 1892-1992, my new analysis (Cummins 2019b) presents a method to estimate hidden wealth. I define ‘hidden’ wealth as wealth missing from the perspective of the probate calendars, and therefore of the tax authorities. A portion of this will be legal portfolio re-arrangement to tax-exempt trusts, inter-vivos bequests, charitable donations, gifts to non-family members, and a portion will potentially be illegal tax evasion.
The method is a simple accounting exercise that exploits the nominal, individual-level data. The key identifying assumption is that wealth declared before 1920 was a more accurate measure of the ‘true’ wealth of a dynasty than wealth declared after 1920. The incentives suggest that this is reasonable – taxes on wealth before 1920 were a tiny fraction of taxes after 1920.
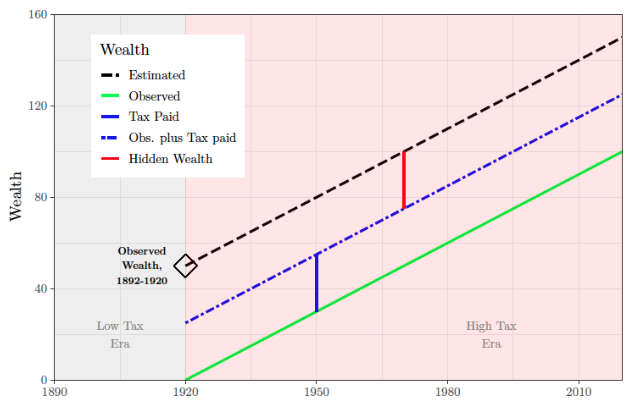
Figure 1 The concept

During the low-tax era of 1892-1920, I sum declared wealth at death, by dynasty. I then calculate an expected flow of inherited wealth that should show up in those same dynasties after 1920. For most, wealth after 1920 is in excess of that predicted by the inheritance flow from 1892-1920. This is newly created wealth. However, for certain dynasties, declared wealth is systematically below expected wealth from inheritance. This is hidden wealth.
For the analysis, I select only rare surnames of English origin which have fewer than 100 people observed in the 1881 census, and track these rare surname dynasties in the probate calendars from 1892 to 1992. Within this group, I define a ‘Victorian elite’ as the top 1,500 richest wealth-holding surnames from 1892 to 1920.
Formally, I compare estimated wealth calculated using the net-of-taxes rate of return on capital on observed dynastic capital during the low-tax pre-war years with that actually observed in the later high-tax post-war era. I incorporate wartime destruction and all death taxes paid into this estimate of ‘true’ inherited-wealth. Figure 1 illustrates the concept for calculating hidden inherited wealth.
At the aggregate, this estimate is lower than observed wealth as new wealth is being created by non-inheriting surname dynasties. However, for the richest English dynasties, the Victorian elite of 1892-1920, it is clear that at least 20-32% of all elite wealth is hidden by their descendants in the period 1950-1992. This is shown in Figure 2.
Figure 2 The missing wealth of Victorian elite lineages

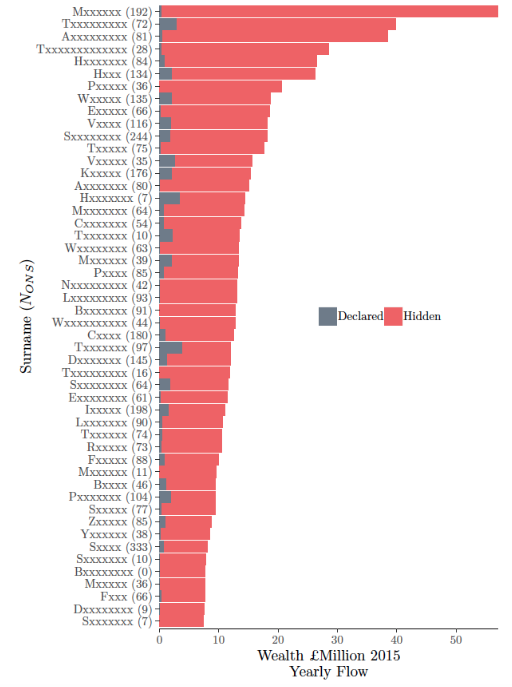
At the individual surname level, this hidden wealth estimate, and the proportion of hidden wealth, strongly predict the appearance of a surname in the recent Offshore Leaks Database (International Consortium of Investigative Journalists 2019). This suggest that a proportion of inheritance taxation is potentially being evaded. Further, the richer the dynasty, the greater the proportion of hidden wealth.
Using the locations of 31 million UK voters from the electoral roll of 1999, and data on the complete price paid for house sales in 2017-8, I show that hidden wealth is associated with more expensive postcodes. Hidden wealth boosts contemporary consumption and the living standards of hiding dynasties. Further, I show that the children of those with hidden wealth are more likely to attend the elite universities of Oxford and Cambridge, over the period 1990-2016.
Figure 3 The top 50 hiding dynasties, hidden and declared wealth

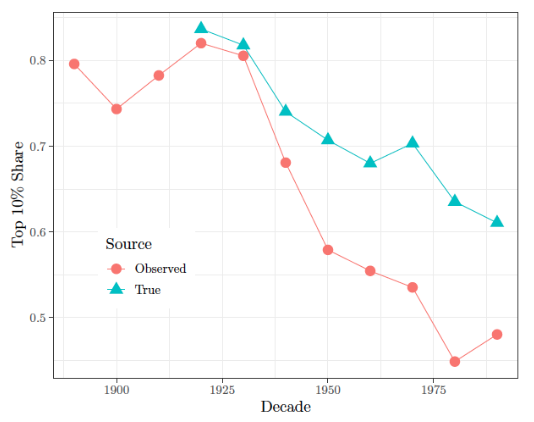
Incorporating this elite hidden wealth into a recalculation of the top decile wealth share shows that the decline of the ‘true’ wealth share is significantly more muted than that for observed wealth. The richest decile holds an extra 10% of the ‘true’ wealth distribution, equivalent to a 33% reversal of the observed decline.
Figure 4 Top 10% shares, observed and ‘true’

In Cummins (2019b), I present a simple method, combining historical and contemporary data, to estimate hidden wealth at the surname level. This method produces a set of surnames that are potentially hiding a large amount of wealth. Tax authorities could use this information to investigate potential evasion.
Internationally, the pattern of a low-tax pre-war era followed by a high-tax post-war period is almost universal. Applying the method presented in this column to other historical wealth data from other countries could lead to the uncovering of vast sums of hidden wealth.
The implications of incorporating hidden wealth into the top wealth shares are of profound importance. Changes in wealth inequality were the largest equalising force in the 20th century. My paper shows that the true top-wealth share did indeed decline, but not by as much as that observed in the reported data. This finding is important for our empirical understanding of the true evolution of inequality over the last century and is crucial for attempts to understand the causal forces behind the ‘Great Equalisation’. It also highlights the need for further research on hidden wealth, both contemporary and historical, in the UK and elsewhere.
References
Alvaredo, F, A B Atkinson and S Morelli (2018), “Top wealth shares in the UK over more than a century”, Journal of Public Economics, issue in honor of Sir Tony Atkinson (1944-2017), 162: 26-47.
Atkinson, A B (2018), “Wealth and inheritance in Britain from 1896 to the present”, Journal of Economic Inequality 16(2): 137-169..
Atkinson, A B, J P F Gordon and A Harrison (1989), “Trends in the shares of top wealth-holders in Britain, 1923-1981”, Oxford Bulletin of Economics and Statistics 51(3): 315-332.
Atkinson, A B and A J Harrison (1978), Distribution of personal wealth in Britain, Cambridge: Cambridge University Press.
Cummins, N (2019a), “Where is the middle class? Inequality, gender and the shape of the upper tail from 60 million English death and probate records, 1892-2016”, CEPR discussion paper 13436.
International Consortium of Investigative Journalists (2019), “Offshore leaks database”. 2019.
Cummins, N (2019b), “Hidden wealth”, CEPR discussion paper 14020.
Piketty, T (2014), Capital in the twenty-first century, Cambridge: Harvard University Press
.
.