Wednesday, October 15, 2014

This Time 'Is' Different - For The First Time In 25-Years The Wall Street Gamblers Are Home Alone

The last time the stock market reached a fevered peak and began to wobble unexpectedly was August 2007. The proximate catalyst back then was the sudden recognition that the subprime mortgage problem was not contained at all, as Bernanke had proclaimed six months earlier. The evidence was the surprise announcement by the monster of the mortgage midway - Countrywide Financial - that it would be taking huge write-downs on its $200 billion balance sheet.
At the time, it had not quite invented the term “fortress balance sheet” per JPMorgan’s later hyperbole, but the market overwhelmingly believed that the orange man—–Angelo Mozillo—-ran a tight ship; that the proponderant share of its business was in “safe” Freddie/Fannie originations and guaranteed paper; and that any losses from the sketchier subprime mortgage business that it had recently entered would be covered by its loan loss reserves and the massive earnings on its GSE book of business. Only now do we know that Countrywide was a house of cards that has cost(so far) its reluctant suitor, Bank of America, upwards of $50 billion in write-offs, losses and settlements.
It is in the nature of bubble finance that markets do not recognize disasters lurking in plain sight. Prior to the August 2007 swoon, Countrywide still had a market cap of $15 billion. Indeed, at that point the combined market cap of Bear Stearns, Freddie Mac and Fannie Mae, Lehman Brothers, AIG and GM, just to name the obvious, was upwards of one quarter trillion dollars!
Markets were most definitely not in the classic “price discovery” business. That is, they were not discovering information about the speculative rot under housing prices or the dealer lots bulging with unsold cars or freshly minted subdivisions where subprime residents were delinquent on both their mortgage and car loans or the adjacent strip malls that had no tenants and no customers.
Instead, the stock market had discovered the “goldilocks economy” - a pleasant place of subdued inflation, measured growth and perpetually rising stock and real estate prices. The most notable point was the belief that the Fed had delivered this salutary state of affairs owing to its enlightened management of the macro-economy, and that this condition could be sustained indefinitely.
Bernanke had somewhat immodestly called this the Great Moderation, and it was reflected in the stock market averages and the capitalization rates they allegedly embodied. Not incidentally, the market had risen nearly continuously for 55 months, and the “buy the dip” brigade of the dotcom era had come back from the dead. So dips got shallower and the setbacks less frequent.
That may sound like the recent past, and it was. The forward consensus of sell-side analysts was that S&P 500 earnings (ex-items) for 2008 would come in around $110 per share or at about 14X based on the July interim high of $1550 per share. Likewise, the NASDAQ had recovered from its thundering crash of 2000-2001 and had climbed by nearly 100% in the four and one-half years through early August 2007.
Needless to say, goldilocks turned out not to be all that. When the macro-economy buckled under the weight of crashing housing and real estate prices, a plunge in home and commercial real estate construction, a severe liquidation of auto and durable goods inventories and the evaporation of phony financial sector profits, the dips became a deathly plunge, and the “attractively valued” 14X market ended up something else altogether.
As it happened, S&P 500 earnings ex-items came in at about $55 per share for 2008, or half of Wall Street’s hockey-stick projections as of August 2007. And if honest accounting, as embodied in GAAP earnings reported to the SEC is considered, the outcome was only $15 per share.
Self-evidently, the stock market was no longer a discounting mechanism by the end of the second Greenspan Bubble in late 2007 when the Great Recession officially commenced. It had essentially become a casino where the hedge funds and day traders made short term bets in a rigged market. In effect, the Greenspan Put had become institutionalized by the liquidity flood that had accompanied the Fed’s slashing of interest rates from 6% to 1% during the 30 month period after the dotcom crash of 2000. There could no longer be any doubt, at least by the lights of Wall Street, that the central bank had a “put” under the market.
By now it seems indisputable that central banks “puts” are a magnificent elixir for stock market gamblers—so long as confidence is maintained and our monetary central planners have the tools and wits to short-circuit the “dips” before they become runaway crashes.In the section from the Great Deformation below, I described how the Fed reacted aggressively to thwart the correction that commenced in August 2007 when the subprime crisis began to manifest its ugly fangs.
As it turned out, the stock market rallied by another 10% before hitting a final peak in October 2007. Moreover, the Fed continued its campaign to put a floor under the market for another 11 months after the peak—even as the credit and stock market bubbles festered and the underlying macro-economy steadily deteriorated. During this interregnum, the Fed capitulated to Wall Street as symbolized by its panicked response to Jim Cramer’s famous rant described below.
But it was ultimately for naught. The market suffered a devastating 55% collapse in the 18 months after the unavoidable correction of the Greenspan Housing Bubble commenced in August 2007. Stated differently, central bank bubbles can be fueled and coddled for an extended period, but ultimately reality sets in.


So here we are once again, and it is once again claimed that this time is different. The 65 month rise of the S&P 500 bears all the hallmarks of a central bank fueled casino—- even more completely than the 2003-2007 run. Also once again, the market is said to be “attractively valued” and that next years earnings(ex-items) at $125 per share represent only a 15X PE multiple. So after the “healthy correction” of the past week or so, it is purportedly time once again to buy the dip.
Except this time is indeed different, but not in a good way. When Bernanke & Co. stalled off the August 2007 correction for nearly a year, they still had plenty of dry powder. The federal funds rate was 5.25% and the Fed’s balance sheet was only $850 billion.
But now, however, we are on the far side of the great monetary experiment known as ZIRP and QE. The money market rate is at the zero bound and has been pinned there for 69 months running—a stretch never before experienced even during the Great Depression. Likewise, the Fed’s balance sheet has grown by 5X to nearly $4.5 trillion—again a previously unimaginable eruption.
These conditions undoubtedly explain the “buy the dips” joy ride pictured above. And they also probably explain why actual LTM GAAP earning at about $102 per share on the S&P 500 are exactly where they were in the fall of 2007—-at the tippy top of the historic range at 19X. But no one cared then— nor apparently do they now.
But what is profoundly different this time is that the Fed is out of dry powder. Its can’t slash the discount rate as Bernanke did in August 2007 or continuously reduce it federal funds target on a trip from 6% all the way down to zero. Nor can it resort to massive balance sheet expansion. That card has been played and a replay would only spook the market even more.
So this time is different.  The gamblers are scampering around the casino fixing to buy the dip as soon as white smoke wafts from the Eccles Building.  But none is coming. For the first time in 25- years, the Wall Street gamblers are home alone.
CHAPTER 23
THE RANT THAT SHOOK THE ECCLES BUILDING
How the Fed Got Cramer’d

After climbing steadily for four and a half years, the stock market weakened during August 2007 under the growing weight of the housing and mortgage debacle. Yet in response to what was an exceedingly mild initial sell-off, the Fed folded faster than a lawn chair in a desperate attempt to prop up the stock averages. The “Bernanke Put” was thus born with a bang.

The frenetic rate cutting cycle which ensued in the fall of 2007 was a vir- tual reenactment of the Fed’s easing panics of 2001, 1998, and 1987. As in those episodes, the stock market had again become drastically overvalued relative to the economic and profit fundamentals. But rather than permit a long overdue market correction, the monetary central planners began once more to use all the firepower at their disposal to block it.

The degree to which the Bernanke Fed had been taken hostage by Wall Street was evident in its response to Jim Cramer’s famous rant on CNBC on August 3, 2007, when he denounced the Fed as a den of fools: “They are nuts. They know nothing . . . the Fed is asleep. . . . My people have been in the game for 25 years . . . these firms are going out of business . . . open the darn [discount] window.”

In going postal, Cramer was not simply performing as a CNBC commentator, but functioning as the public avatar for legions of petulant day traders who had taken control of the stock market during the long years Greenspan coddled Wall Street. What the Fed utterly failed to realize was that these now-dominant Cramerites had nothing to do with free markets or price discovery among traded equities.

AUGUST 2007: WHEN THE FED CAPITULATED TO FINANCIAL HOODLUMS
The idea of price discovery in the stock market was now an ideological illusion. The market had been taken over by white-collar financial hoodlums who needed a trading fix every day. Through Cramer’s megaphone, these punters and speculators were asserting an entitlement to any and all gov- ernment policy actions which might be needed to keep the casino running at full tilt.

If that had not been clear before August 2007, the truth emerged on live TV. The nation’s central bank was in thrall to a hissy fit by day traders. In a post the next day, the astute fund manager Barry Ritholtz summarized the new reality perfectly: “I have two words for Jim: Moral Hazard. Contrary to everything we learned under Easy Alan Greenspan, it is not the Fed’s role to backstop speculators and guarantee a one way market.”

Yet that is exactly what it did. Within days of the rant which shook the Eccles Building, the Fed slashed its discount rate, abruptly ending its tepid campaign to normalize the money markets. By early November the funds rate had been reduced by 75 basis points, and by the end of January it was down another 150 basis points. As of early May 2008 a timorous central bank had redelivered the money market to the Wall Street Cramerites. Although the US economy was saturated with speculative excess, the Fed was once again shoveling out 2 percent money to put a floor under the stock market.

This stock-propping campaign was not only futile, but also an exercise in monetary cowardice; it only intensified Wall Street’s petulant bailout de- mands when the real crisis hit a few months later. Indeed, on the day of Cramer’s rant in early August 2007, the S&P 500 closed at 1,433. The broad market index thus stood only 7 percent below the all-time record high of 1,553, which had been reached just ten days earlier in late July.

Ten days of modest slippage from the tippy-top of the charts was hardly evidence of Wall Street distress. Even after it drifted slightly lower during the next two weeks, closing at 1,406 on August 15, the stock market was still comfortably above the trading levels which prevailed as recently as January 2007.

Still, the Fed threw in the towel the next day with a dramatic 50 basis point cut in the discount rate. Although no demonstration was really needed, the nation’s central bank had now confirmed, and abjectly so, that it was ready and willing to be bullied by Cramerite day traders and hedge fund speculators. The latter had suffered a “disappointing” four weeks at the casino; they wanted their juice and wanted it now.

Needless to say, the stock market cheered the Fed’s capitulation, with the Dow rising by 300 points at the open on August 17. The chief economist for Standard & Poor’s harbored no doubt that the Fed’s action was a deci- sive signal to Wall Street to resume the party: “It’s not just a symbolic ac- tion. The Fed is telling banks that the discount window is open. Take what you need.”

The banks did exactly that and so the party resumed for another few months. By the second week of October the market was up 10 percent, enabling the S&P 500 to reach its historic peak of 1,565, a level which has not been approached since then.

Pouring on the monetary juice and signaling to speculators that it once again had their backs, the Fed thus wasted its resources and authority for a silly and fleeting prize: it was able to pin the stock market index to the top rung of its historic charts for the grand duration of about six weeks in the fall of 2007. There was no more to it, and no possible excuse for its panic rate cutting.

HOW THE FED GOT CRAMER’D
The Fed’s abject surrender to the Cramerite tantrums in the fall of 2007 was rooted in ten years of Wall Street coddling. Mesmerized by its new “wealth effects” doctrine, the Fed viewed the stock market like the famous Las Vegas ad: it didn’t want to know what went on there, and was therefore oblivious to the deeply rooted deformations which had become institu- tionalized in the financial markets. The sections below are but a selective history of how the nation’s central bank finally reached the ignominy of being Cramer’d by financial TV’s number one clown.

The monetary central planners only cared that the broad stock averages kept rising so that the people, feeling wealthier, would borrow and spend more. It falsely assumed that what was going on inside the basket of 8,000 publicly traded stocks was just the comings and goings of the free market— and that this was a matter of tertiary concern, if any at all, to a mighty cen- tral bank in the business of managing prosperity and guiding the daily to-and-fro of a $14 trillion economy.

But what was actually going on in the interior of the stock market was nightmarish. All of the checks and balances which ordinarily discipline the free market in money instruments and capital securities were being evis- cerated by the Fed’s actions; that is, the Greenspan Put, the severe repres- sion of interest rates, and the recurrent dousing of the primary dealers with large dollops of fresh cash owing to its huge government bond purchases.

This kind of central bank action has pernicious consequences, however. By pegging money market rates, it fosters carry trades that are a significant contributor to unbalanced markets. Carry trades create an artificially en- larged bid for risk assets. So prices trend asymmetrically upward.

The Greenspan Put also compounded the one-way bias. For hedge fund speculators, it amounted to ultra-cheap insurance against downside risk in the broad market. This, too, attracted money flows and an inordinate rise in speculative long positions.

The Fed’s constant telegraphing of intentions regarding its administered money market rates also exacerbated the stock market imbalance. By peg- ging the federal funds rate, it eliminated the risk of surprise on the front end of the yield curve. Consequently, massive amounts of new credit were created in the wholesale money markets as traders hypothecated and re- hypothecated existing securities; that is, pledged the same collateral for multiple loans.

The Fed’s peg on short-term rates thus fostered robust expansion of the shadow banking system, which as indicated previously, had exploded from $2 trillion to $21 trillion during Greenspan’s years at the helm. This vast multiplication of non-bank credit further fueled the “bid” for stocks and other risk assets.

Fear of capital loss, fear of surprise, fear of insufficient liquidity—these are the natural “shorts” on the free market. The paternalistic Dr. Green- span, trying to help the cause of prosperity, thus took away the market’s natural short. In so doing, he brought central banking full circle. William McChesney Martin said the opposite; that is, he counseled taking away the punch bowl, thereby adding to the short. Now the punch bowl was over- flowing and the short was gone.

Speculators were emboldened to bid, leverage their bid, and then to bid again for assets in what were increasingly one-way markets. As time passed, more and more speculations and manipulations emerged to capi- talize on these imbalances.

“Growth stocks” were always a favored venue because they could be bid- up on short-term company news, quarterly performance, and rumors of performance (i.e., “channel checks”). During these ramp jobs, which ordinarily spanned only weeks, months, or quarters, traders could be highly confident that the Fed had interest rates pegged and the broad market propped.

Financial engineering plays such as M&A and buybacks came to be es- pecially favored venues because these trades tended to be event triggered. Upon rumors and announcements, these trades could generate rapid replication and money flows. Again, speculators were confident that the Fed had their back, while leveraged punters were pleased that it had seconded to them its wallet in the form of cheap wholesale funding.

At length, the stock market was transformed into a place to gamble and chase, not an institution in which to save and invest. Since this gambling hall had been fostered by the central bank rather than the free market, it was not on the level. That means that most of the time most of the players won and, as shown below, the big hedge funds which traded on Wall Street’s inside track with its inside information won especially big and un- usually often.

Needless to say, frequent wins and hefty windfalls created expectations for more and more, and still more winning hands. As the Greenspan bub- bles steadily inflated—both in 1997–2000 and 2003–2007—these expecta- tions morphed into virtual Wall Street demands that the Fed keep the party going. Wall Street demands for a permanent party, at length, congealed into the presumption of an entitlement to an ever rising market, or at least one the Fed would never let falter or slump.

Finally, this entitlement-minded stock market became a blooming, buzzing madhouse of petulance, impatience, and greed. Cramer embodied it and spoke for it. By the time of his rant, the Fed had become captive of the monster it had created. Now, fearing to say no, it became indentured to juicing the beast. After August 17, 2007, there was no longer even the pretense of reasoning or deliberation about policy options in the Eccles Building. The only options were the ones that had gotten it there: print, peg, and prop.

One of the great ironies of the Greenspan bubbles was that the free market convictions of the maestro enabled the Fed to drift steadily and irreversibly into its eventual submission to the Cramerite intimidation. It did so by turning a blind eye to lunatic speculations in the stock market, dismissing them, apparently, as the exuberances of capitalist boys and girls playing too hard. By the final years of the first Greenspan bubble, however, there were plenty of warning signals that there was more than exuberance going on. Hit-and-run momentum trading and vast money flows into the stocks of serial M&A operations were signs that normal market disciplines were not working. Indeed, the M&A mania was a powerful indictment of the Fed’s prosperity management model.

These hyperactive deal companies with booming share prices were be- ing afflicted ever more frequently with sudden stock price implosions that couldn’t have been merely random failures on the free market. Yet, as in the case of the subprime mania, the central planners undoubtedly read the headlines about these recurring corporate blowups and never bothered to connect the dots.

Monday, October 13, 2014

Who Will Save Stocks Now?

The stock market is in a perilous state.

Ever since 2008, anytime stocks began to collapse sharply, “someone” stepped in and put a floor under the market.

In 2010, the S&P 500 staged a death cross, where its 50-DMA broke below its 126-DMA (the half year moving average). Stocks were in a perilous state with the 2008 Crash still in everyone’s short-term memory.


The Fed stepped in, hinting at, then all but promising, and then finally launching QE 2 in July, August, and then November, respectively.

This set off a rally in stocks that lasted until the EU Crisis erupted in full force in 2011. Once again stocks staged a death cross. And once again, the Fed stepped in with promises of action followed by the announcement of Operation Twist in September 2011. Stocks took off and we were back to the races.


Which brings us to 2012. Europe was really going down in flames. Greece, then Portugal, and even Spain were lining up for bailouts. And the bailouts were getting larger by the month with Spain requesting €100 billion in June 2012.

ECB President Mario Draghi promised to do “whatever it takes” to hold the EU together. But the carnage was spilling over even into US markets. So Bernanke’s Fed promised yet another QE program, though this new program would be “open-ended” in June.

Sure enough, Bernanke unveiled QE 3 in September 2012. He then upped the ante, unveiling QE 4 in November 2012.


Stocks took off again, launching one of the sharpest, strongest rallies in history:


Which brings us to today. Stocks once again are in trouble, having taken out their 50-DMA, and the 126-DMA. We’re likely just a few weeks away from another “death cross”… and the Fed is fully committed to ending QE at the end of the month.


Moreover, the ECB is having trouble engaging in QE because Germany is not overly fond of the idea. China just announced that it will not engage in a large scale stimulus program in the near future. And the Bank of Japan has admitted it will likely not announce another massive QE program anytime too soon.

So who will save stocks this time?

If you’ve yet to take action to prepare for the second round of the financial crisis, we offer a FREE investment report Financial Crisis "Round Two" Survival Guide that outlines easy, simple to follow strategies you can use to not only protect your portfolio from a market downturn, but actually produce profits.

Russia’s two largest banks plan SWIFT alternative

The two biggest banks in Russia, Sberbank and VTB, are in talks to create an alternative to the SWIFT global system for interbank financial communications, VTB head Andrey Kostin said.
According to Kostin, Russia has two options: either use the system run by the Russian Central Bank or create a new homegrown transaction platform.
“There is an alternative, we can use the Central Bank system that is already in operation, and we may make our own, we are already in discussions with Sberbank,” Kostin told reporters in Washington DC, where he is for the annual fall meetings of the International Monetary Fund (IMF) and World Bank.
However, the catch with the Central Bank’s international transaction system is the price.
“It’s expensive, in fact several times more expensive than the SWIFT payment system,” the VTB head said.
“If we create our own interbank system, which isn’t difficult at all and we are in the process of doing, it will be cheaper. And then hold talks with the Central Bank,” Kostin said.
Switching Russia off SWIFT, the Society for Worldwide Interbank Financial Telecommunication, would instantly isolate it from global finance, as happened with Iran in 2012. According to reports, EU leaders, especially in Britain, were discussing the option as a sort of super sanctions to punish Russia for its involvement in the Ukraine crisis. Many US senators have also been pushing to block Russia from SWIFT payments.
SWIFT, the Brussels-based global payments system, said last week that they wouldn’t succumb to political pressure and cut Russian payments and would continue services. The group said that disconnecting Russia violates the company’s mission and that it doesn’t make such unilateral decisions.
However because it’s based in Brussels, it would have to comply with any greater EU ruling.
Last month the SWIFT system transmitted more than 21 million financial messages a day between more than 10,500 financial institutions and corporations in 215 countries.
The Russian National SWIFT Association, or ROSSWIFT for short, is the second biggest worldwide, after the US.
http://rt.com/business/195472-russia-sberbank-vtb-swift/ 

"Prepare For Runs", IMF Warns Policymakers Of "Elevated Financial Stability & Liquidity Risks"

The extended period of monetary accommodation and the accompanying search for yield are leading to credit mispricing and asset price pressures, increasing the chance that financial stability risks could derail the recovery.

 [6]

Concerns have shifted to the shadow banking system, especially the growing share of illiquid credit in mutual fund portfolios.
Should asset markets come under stress, an adverse feedback loop between outflows and asset performance could develop, moving markets from a low- to a high-volatility state, with negative implications for emerging market economies.
 [7]

Funds investing in credit instruments have a number of features that could result in elevated financial stability risks.
First is a mismatch in liquidity offered by investment funds with redemption terms that may be inconsistent with the liquidity of underlying assets. Many credit funds hold illiquid credit instruments that trade infrequently in thin secondary markets.

Second is the large amount of assets concentrated in the hands of a few managers. This concentration can result in “brand risk,” given that end-investor allocation decisions are increasingly driven by the perceived brand quality of the asset management firm. Sharp drawdowns in one fund of an asset manager could propagate redemptions across funds for that particular asset manager if its brand reputation is damaged, for example through illiquidity or large losses.

Third is the concentration of decision making across funds of an individual fund manager, which can reduce diversification benefits, increase brand risk, or both.

Fourth is the concentrated holdings of individual issuers, which can exacerbate price adjustments.

Fifth is the rise in retail participation, which can increase the tendency to follow the herd.
These features could exacerbate the feedback loop between negative fund performance and outflows from the sector, leading to further pressure on prices and the risk of runs on funds. These risks could become more prominent in the coming year as the monetary policy tightening cycle begins to gain traction.
 [8]

Such stress might be triggered as part of the exit from unconventional monetary policy or by other sources, including a sharp retrenchment from risk taking due to higher geopolitical risks.
And, as we have discussed numerous times previously, less liquidity is available from traditional liquidity
providers...
 [9]

The IMF is worried...
Policymakers and markets need to prepare for structural higher market volatility. Doing so requires strengthening the system’s ability to absorb sudden portfolio adjustments, as well as addressing structural liquidity weaknesses and vulnerabilities.

Advanced economies with financial markets at risk for runs and fire sales may need to put in place mechanisms to unwind funds should they come under substantial pressure that threatens wider financial stability.
Source: IMF

Friday, October 10, 2014

The Stronger Dollar = Stealth QE

Whether this trend will hold or reverse is unknown, but it does suggest that there are advantages to being the cleanest shirt in the dirty laundry.
Dave at Trade with Dave recently posed an interesting question: Is A Stronger Dollar Stealth QE? The question might seem wonky, but it's actually a nuts-and-bolts topic in the context of a larger question: why is the U.S. economy now the shining beacon of growth (albeit modest) in a world rolling over into recession?

As I understand Dave's thinking, the dynamic works something like this: in QE (quantitative easing), the Fed creates money out of thin air and pushes it into the financial system, with the hope that some of that inflow of cash will trickle down into the real economy.
 
A stronger dollar encourage foreign capital to flow into the U.S., as it makes more sense to shift money into appreciating dollars (that are gaining purchasing power) than leave it in currencies that are depreciating (losing purchasing power compared to the dollar).
 
This inflow of new money into U.S. bank accounts, bonds, stocks and real estate is more or less the equivalent of the Fed's QE operations, minus the money-creation step.
 
So in terms of fresh money flowing into the U.S. financial sector, capital inflows driven by the stronger dollar are generating the same effect as the Fed's QE.
 
Does this matter? At a minimum, it gives the Fed a PR victory, as the Fed has the freedom to end QE without upsetting the apple cart too severely. It also gives the Fed the freedom to keep interest rates low without all the bond-buying of QE, because overseas buyers are snapping up bonds and other dollar-denominated assets.
 
Some observers think the money-printing baton has simply been passed to the European Central Bank, China's central bank and the Bank of Japan, and all that new money is finding it's way into the U.S. financial system. In effect, the Fed gets the PR victory of ending its own money-printing operation because other central banks are doing the heavy lifting and the U.S. is benefiting from all their money creation.
 
It's not easy to track capital flows, and so it may not be possible to provide a definitive answer to this inquiry. But it does seem that the relative strength of the U.S. economy vis a vis other major economies and the emerging markets is supporting U.S. assets (broadly speaking--this week's stock market freefall notwithstanding) via capital flows from weaker economies and currencies.
 
Whether this trend will hold or reverse is unknown, but it does suggest that there are advantages to being the cleanest shirt in the dirty laundry (insert your metaphor of choice).

Swiss National Bank Explains Why It Is Against Repatriating Gold

The Swiss National Bank has lashed out at the so-called "gold initiative" efforts to "Save Our Swiss Gold" unsurprisingly proclaiming it as a bad idea. AsRon Paul previously noted, "The gold referendum, if it is successful, will be a slap in the face to those elites," and so the full-court press ahead of the Nov 30th vote has begun (a la Scotland fearmongery) as SNB Vice Chairman Jean-Pierre Danthine explains how a 'yes' vote for the initiative"would severely constrain the SNB’s room for manoeuvre in a future crisis," as it "poses danger to the conduct of a successful monetary policy." His reasoning (below) is stunning...
On 30 November, the Swiss electorate will vote on the so-called “gold initiative” (“Save our Swiss gold”, in full), which, paradoxically, would severely constrain the SNB’s room for manoeuvre in a future crisis. Let me digress for a few minutes to explain why the SNB is opposed to this initiative.
The initiative is calling for three things:
first, the SNB should hold at least 20% of its assets in gold;

second, it should no longer be allowed to sell any gold at any time; and

third, all of its gold reserves should be stored in Switzerland.
Let me address the last point first. Today, 70% of our gold reserves are stored in Switzerland, 20% are held at the Bank of England and 10% at the Bank of Canada. As you know, a country’s gold reserves usually have the function of an asset to be used only in emergencies.
For that reason, it makes sense to diversify the storage locations. In addition, it makes sense to choose locations where gold is traded, so that it can be sold faster and at lower transaction costs. The UK and Canada both meet that criterion. In addition, they both have a strong and reliable legal system and we have every assurance that our gold is safe there.
The initiative’s demand to hold at least 20% of our assets in gold would severely restrict the conduct of monetary policy. Monetary policy transactions directly change our balance sheet.
Restrictions on the composition of the balance sheet therefore restrict our monetary policy options. A telling example is our decision to implement the exchange rate floor vis-à-vis the euro that I mentioned above: with the initiative’s legal limitation in place, we would have been forced during our defence of the minimum exchange rate not only to buy euros, but also to buy gold in large quantities. Our defence of the minimum exchange rate would thus have involved huge costs, which would almost certainly have caused foreign exchange markets to doubt our resolve to enforce the rate by all means.
Even worse consequences would result from the initiative’s proposal to prohibit the sale of gold at any time. An increase in gold holdings could not be reversed, even if necessary from a monetary policy perspective. In combination with the obligation to hold at least 20% of total assets in gold, this could gradually lead the SNB into a situation where its assets would mainly consist of gold: each extension of the balance sheet for monetary policy reasons would necessitate gold purchases, but whenever the balance sheet needed to be reduced again for the same reasons, we would not be able to resell our gold holdings. This would severely restrict our room for manoeuvre.
Furthermore, because gold pays no interest or dividends, the SNB’s ability to generate profits and distribute them to the Confederation and the Cantons would be impaired.
As a final point, note that currency reserves which cannot be sold are not truly reserves. It does not make sense to call for an increase in emergency reserves – gold holdings – and simultaneously prohibit the use of these reserves even in emergencies.
The SNB’s overriding objection to the gold initiative stems from the danger it poses to the conduct of a successful monetary policy. It would severely impair the SNB’s ability to fulfil its constitutional and legal mandate to ensure price stability while taking due account of economic developments, in the interests of the country as a whole.
*  *  *
We will hazard a guess that the voting will go exactly as Scotland's independence vote went - young vote for it, old against it... as fearmongering status quo managers step up the propaganda with no regard for what happens next.

Did Today's "Satan Signal" In S&P Futures Give The 'All-Clear' For Selling To Begin?

Even Bob Pisani knows by now that the European Close seems to create a trend-reversal moment intraday that few machines (and even fewer humans) are willing to fight. Whether this is remnants of short-term cycles found due to POMO or just a drop in liquidity is unclear; but what is clear, it happens, and all too regularly... except today. After a notably weak start to the day, the machines were just getting revved up for the 1130ET reversal to kick in and lift the market back to VWAP when a curious thing happened... "someone" canceled-and-replaced orders for 666 contracts 26 times in the 1130ET to 1200ET period... and selling accelerated lower, no reversal, to close at the lows on heavy volume.


Thanks to the incredibly detailed work of Nanex's Eric Hunsader, we can see the 'secret' signal that only the HFTs would have been capable of seeing...

For a sense of how out of place this was, here is the quote size histogram for that period:

We are sure this is nothing... just pure coincidence that on the 4th most active trading day in history and on following a huge surge day in stocks not trusted by any other asset class, someone would send 26 separate times in a few minutes orders for 666 contracts.
Only a tin-foil-hat-wearing digital dickweed would see anything odd about that: for everyone else this is merely yet another market anomaly that is best left unmentioned.
*  *  *
Oh, one more thing, this all happened just after VIX 'fat-fingered' spike down and VXX volume surged, launching today's selloff.

Tuesday, October 7, 2014

Russia Spends Up to $1.75 Billion in Two Days to Buoy Ruble

Russia’s central bank spent as much as $1.75 billion to prop up the ruble over the last two trading days, its biggest market intervention since President Vladimir Putin’s incursion into Ukraine in March.
Russia’s central bank spent the equivalent of $980 million to shore up the ruble on Oct. 3, the latest data on the authority’s website showed today. The bank also said it shifted the upper boundary of the currency’s trading band by 10 kopeks yesterday, a move that may have involved spending between $420 million and $769 million that day. The exchange rate weakened 0.3 percent to 44.6234 versus the basket by 5:12 p.m. in Moscow, set for a record low for the fourth time this month.
Putin is suffering the consequences for shaking up the post-Cold War order in eastern Europe as the U.S. and European Union impose sanctions on his economy and investors pull money out of the country. Demand for dollars and euros is growing among Russian companies locked out of western debt markets as they contend with $54.7 billion of debt repayments in the next three months, according to central bank data.

Saturday, October 4, 2014

Market Breadth Has Collapsed Around The World

The 100-day moving average of the advance/decline ratio for the MSCI World Index has collapsed to its lowest level since November 2008.
image

Out of the 46 MSCI country indices, we count 20 countries where the 100-day moving average of the advance/decline ratio is at its lowest level since 2008 or below it.
Below are charts for the MSCI World Index and MSCI Emerging Markets Index as well as our top 10 worst advance/decline country charts.

image

image

image

image

image

image

image

image

image
image

King dollar rules: Betting on the buck

Amid wild fluctuations in stocks and range-bound trading in bonds this week, the U.S. dollar marched ever higher. 
The currency is set to finish another week stronger, which would mark 12-straight weeks of gains, the longest winning streak ever. 
And pros say though the move has been sharp, the uptrend is still firmly intact. 
Kyu Oh | E+ | Getty Images
First, a warning: Buying the dollar is the trade du jour. As the U.S. economy flexes its muscles amid an increasingly uncertain global backdrop, more investors have jumped on the strong dollar bandwagon. 
Weekly data from the Commodities Futures Trading Commission show hedge funds and other large speculators' positions have increased substantially in the past few weeks, and the net long dollar bet now stands at $35.81 billion, not far from its its highest ever. 
Net shorts on the euro and yen grew larger as well. 
Those crowded trades mean the dollar is vulnerable to a painful drop when momentum turns on any given day and trades unwind. 
However, it doesn't change the logic for buying the dollar and the currency's trajectory.
"As the Fed steps away from ultra-loose policies, the dollar should gain against the chief beneficiaries of those policies, namely emerging market and commodity currencies," currency strategists led by Kit Juckes at Societe Generale wrote in a note this week.
That goes for the dollar against emerging markets' currencies, too.
"The jump in total debt levels in the emerging markets in recent years leaves them vulnerable to rising interest rates and a resurgent dollar," Juckes wrote.
In the third quarter, the dollar index shot up 7 percent, the biggest gain since the third quarter of 2008, when investors everywhere were scrambling for safe-haven assets as the financial crisis gripped the globe.
Lee Hardman, currency strategist at Bank of Tokyo Mitsubishi, found that after a strong quarterly performance, there's still scope for further gains.
"Looking back over the last 20 years, we found that similarly large quarterly gains have tended to be followed by further, although more modest, gains in the following quarter," Hardman wrote in a note this week. 
"Technical momentum indicators have climbed to extremely overbought levels signaling a high risk of a near-term correction lower for the U.S. dollar before it resumes its uptrend."

Wednesday, October 1, 2014

Russian Central Bank rejects capital controls as ruble hits lowest level since 1998

The ruble slid to a new record low of 39.71 against the dollar Tuesday. The Russian Central Bank has been quick to quash fears it would re-introduce capital controls to limit the amount of foreign currency purchases, or even moved outside the country.
“Bank of Russia is not considering the introduction of any restrictions on cross-border capital flows as it was reported in some publications in the mass-media,” the bank said in a statement on Tuesday evening.
The bank’s statement followed a report by Bloomberg News citing anonymous officials that the bank is considering imposing capital controls, as the ruble hit new historic lows.
The Central Bank said it would intervene once the euro-dollar currency basket against the ruble reached a level of 44.4, which it reached on Tuesday before quickly retreating.
Capital controls are a monetary tool by Russia’s key lender to restrict money flowing overseas, which in Russia is projected to reach $100 billion in 2014, nearly on par with the $120 billion that fled in 2008 when the financial crisis hit. In 2007 Russia had a positive net capital inflow.
Andrey Kostin, Chairman and CEO of VTB, doesn’t believe that Russia will impose capital controls just yet, talking to CNBC at VTB’s annual investment forum ‘Russia Calling!’.
“The basic issue now is whether the Russian leadership, under the circumstances, will switch to the model of a mobilization economy, and introduce the old mechanism of currency control, or they will stay on the principle of their open market economy. I think that is the big question that will be asked tomorrow,”Kostin said.
Russia repealed capital controls in 2006, however last week Central Bank Chairwoman Elvira Nabiullina said that Moscow would consider “non-standard” mechanisms to ensure economic stability.
Capital controls aren’t the only monetary tool the Central Bank could consider. If the ruble continues to weaken, it may decide to re-start currency interventions, pumping in billions of dollars to artificially prop up the currency. This would be a policy reversal for the bank, which has recently loosened its monetary controls in order to make the overvalued ruble free floating by 2015.
“Never say never, but not at this stage, definitely,” the VTB CEO said when asked if capital controls are on the horizon.

Caught On Tape: HFT Algo Manipulating GOOGL 1000 Times Per Second

It is very common to find examples of stock quotes changing rapidly - hundreds and sometimes thousands of times per second in a single stock. At the extreme, we've seen in excess of 25,000 quote changes in a single stock in one second of time or less (this page has a chart that documents every extreme example). Often there are no trades during these events. Sometimes a simple pattern evolves from the quote price changes, such as in the case of a certain High Frequency Trading (HFT) algorithm that we've recently seen run every day in Google stock.
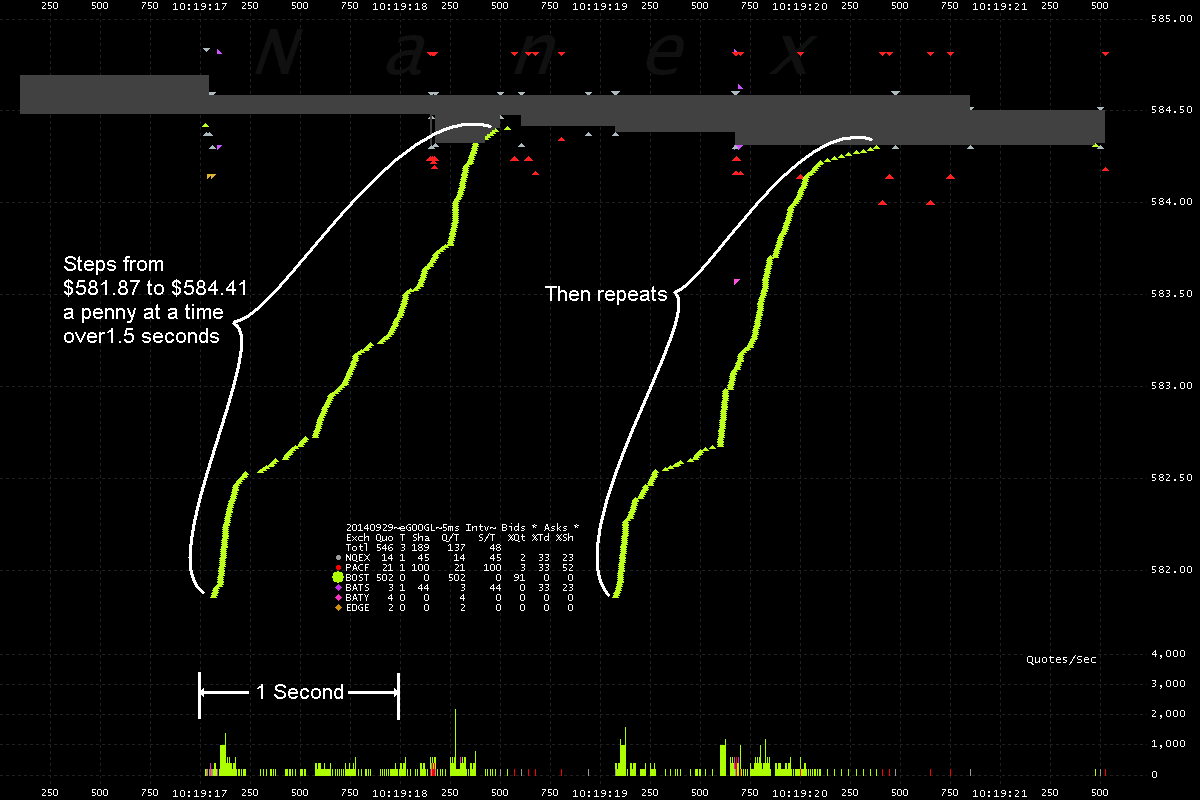
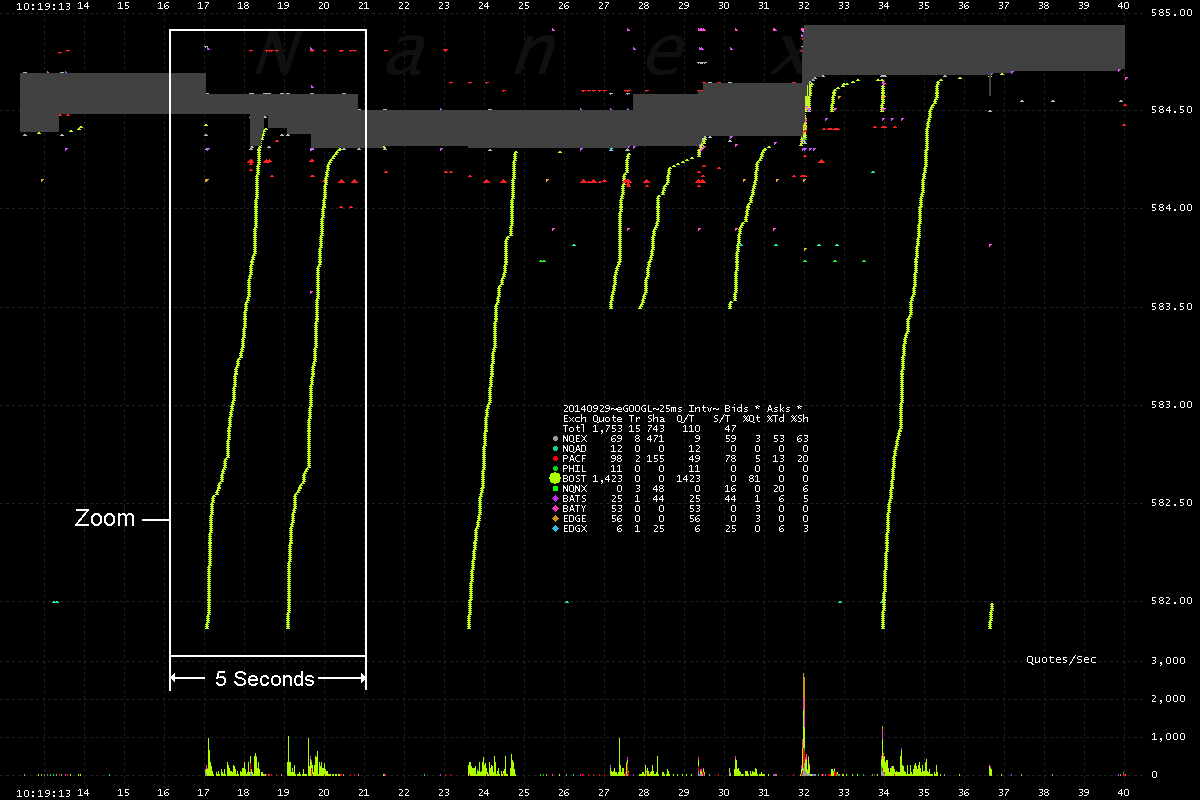
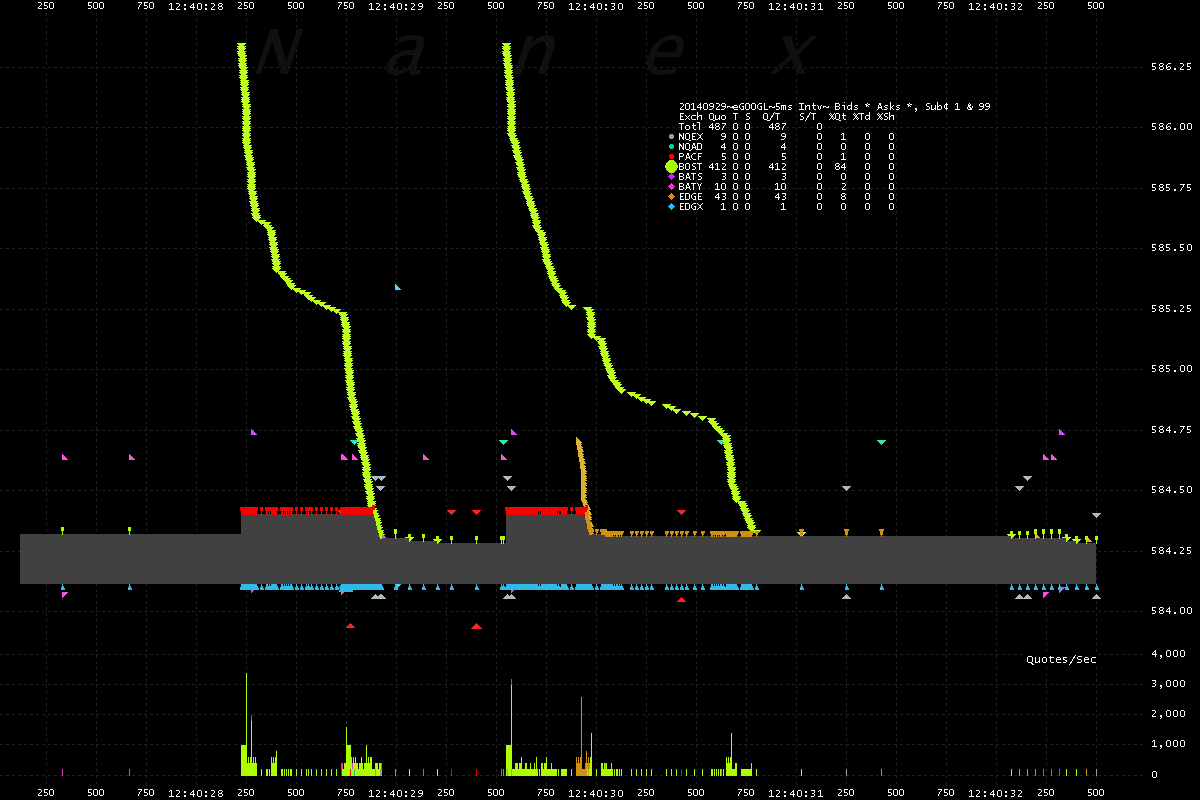
This particular algorithm starts with a bid (or offer) several dollars away from the bids (offers) from one of the other 10 exchanges trading Google Class A stock (symbol GOOGL). We've also seen this algo running in other higher priced stocks. The algo in this example only appears to run from the Nasdaq-Boston (BOST) exchange. In the chart below, we show bids and offers color coded by reporting exchange (there are 10 exchanges in GOOGL). Note that these are "top of book" quotes - that is, they are the highest bid price and lowest ask price from that exchange. The best top-of-book bid and ask become the National Best Bid/Offer (NBBO) and  is shown as light gray shading in these charts. Note, this algo only affects the NBBO when it gets near the end of its price stepping loop.
The algo starts with an order to buy 100 shares at $581.87. This is replaced, sometimes only milliseconds later, with an order to buy 100 shares at $581.88 (1 penny higher). Over the course of 1.5 seconds, this process repeats another 253 times, ending with a order to buy at $584.41. Within less than a second, the $584.41 order is canceled and replaced with an order several dollars lower, and the cycle repeats.
In the case below, the number of quote changes from this HFT algo is averaging 175 per second, but during some periods the rate approaches 1000 per second (1 per millisecond).
1. GOOGL bids and asks color coded by reporting exchange over a 5 second period of time.


Now, some folks (particularly the math/physics challenged) will say:
"So what? HFT needs to be able to cancel quotes fast so they can tighten spreads, add liquidity and lower costs."
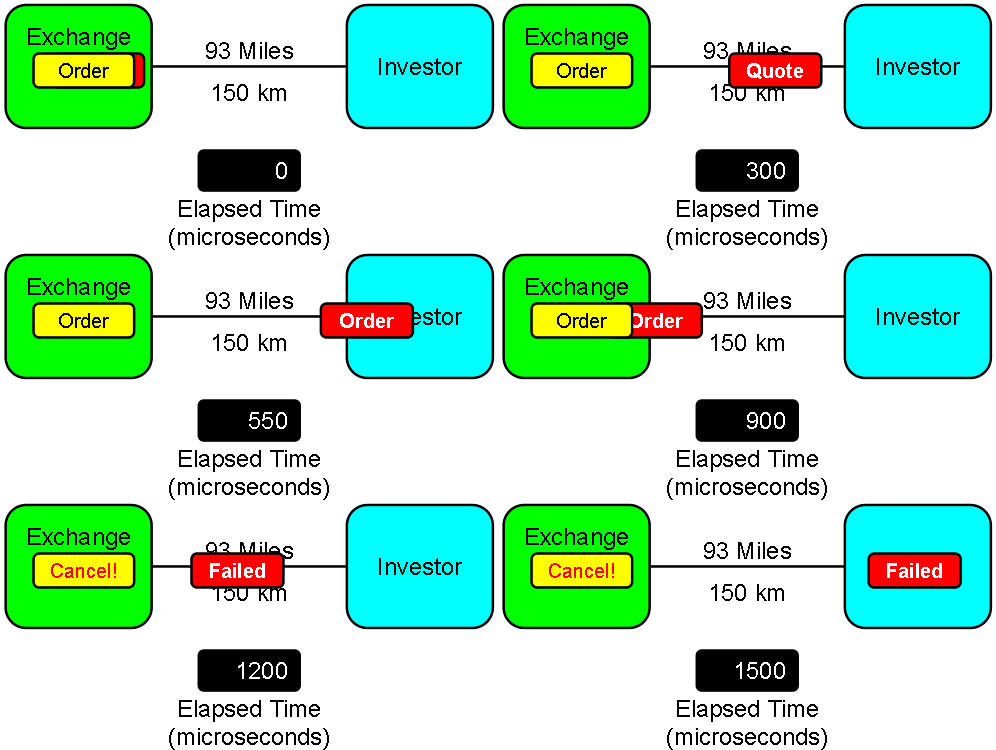
The problem is that when HFT cancels a quote after just 1 millisecond (ms), then anyone located more than 93 miles (150 km) away will see a stale quote. Worse, they won't know it's stale unless and until they try to act on it and wait for a response. The animation below shows how this works. Note, this animation assumes zero processing time on the part of the investor or any other real-world delays. In other words, this is the best possible case, and it will be much worse for the investor in the real-world.
  • The animation starts at an Elapsed Time of 0 microseconds. 1 microsecond (?s) is 1 millionth of a second. 1000 ?s is 1 millisecond (ms).
  • HFT places an order at the top of an exchange's order book, which causes a quote to be transmitted out to investors.
  • An investor 93 miles away receives the quote after 500 ?s (0.5 ms).
  • Assuming the perfect case, the investor immediately acts on the quote and transmits an order to the exchange (really their broker, but let's assume a perfect world).
  • The exchange won't see this investor's order until a total elapsed time of at least 1000 ?s (1 ms).
  • HFT changes its mind after 1 ms and cancels the order - just before the investor's order arrives.
  • The investor won't know that their order failed for another 500 ?s or a total of 1500 ?s since HFT sent the initial order!


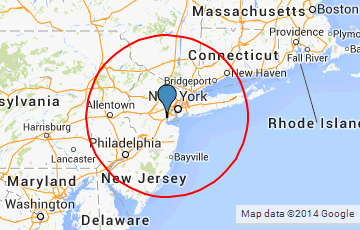
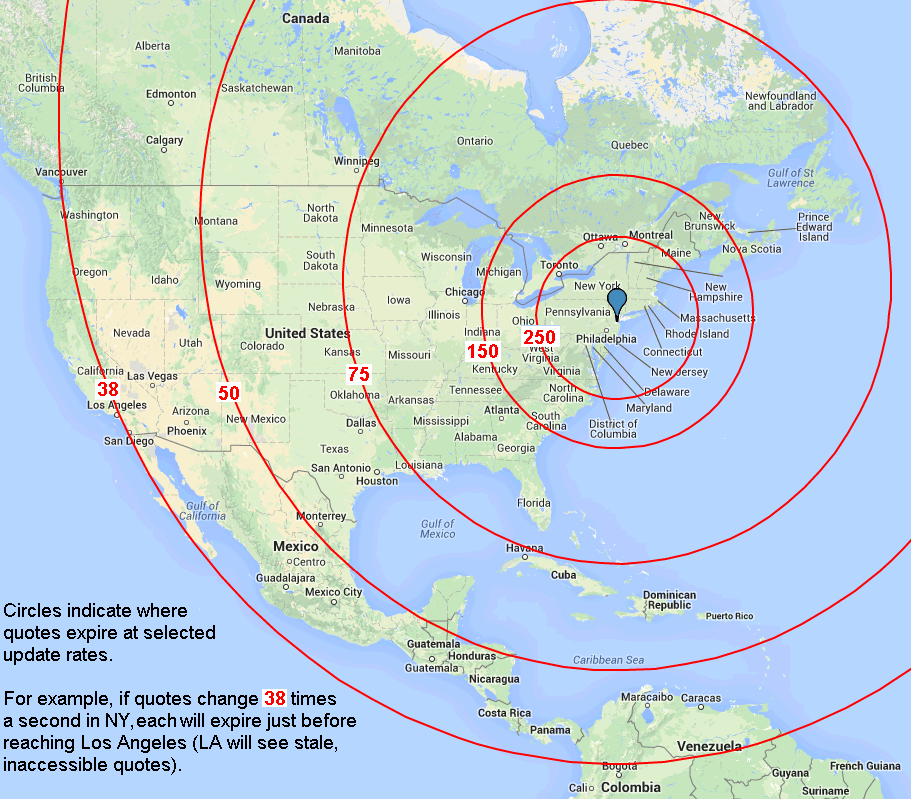
Effectively, when HFT changes its mind 1000 times a second (or after 1 millisecond) anyone located outside the (93 miles/150 km) circle below will receive stale quotes:
An expanded map is shown below. Each red circle shows how far quotes can travel before expiring at different update rates. For example, the ring labeled 150 is how far quotes will get if HFT is canceling and replacing 150 quotes each second. At 150 quotes/second, people in Chicago will be processing quotes they can't act on! People in Los Angeles have it even worse - quotes changing just 38 times a second will render them all obsolete by the time Los Angelians or anyone on the Google Campus in Stanford California first sees them.
Now, look back at the example in Google above - that HFT algo was changing Google quotes an average of 175 per second, which means those quotes were expiring somewhere between the two rings labeled 150 and 250 in the map below.

Back to our Google example, let's zoom out and see how often this HFT algo is running.
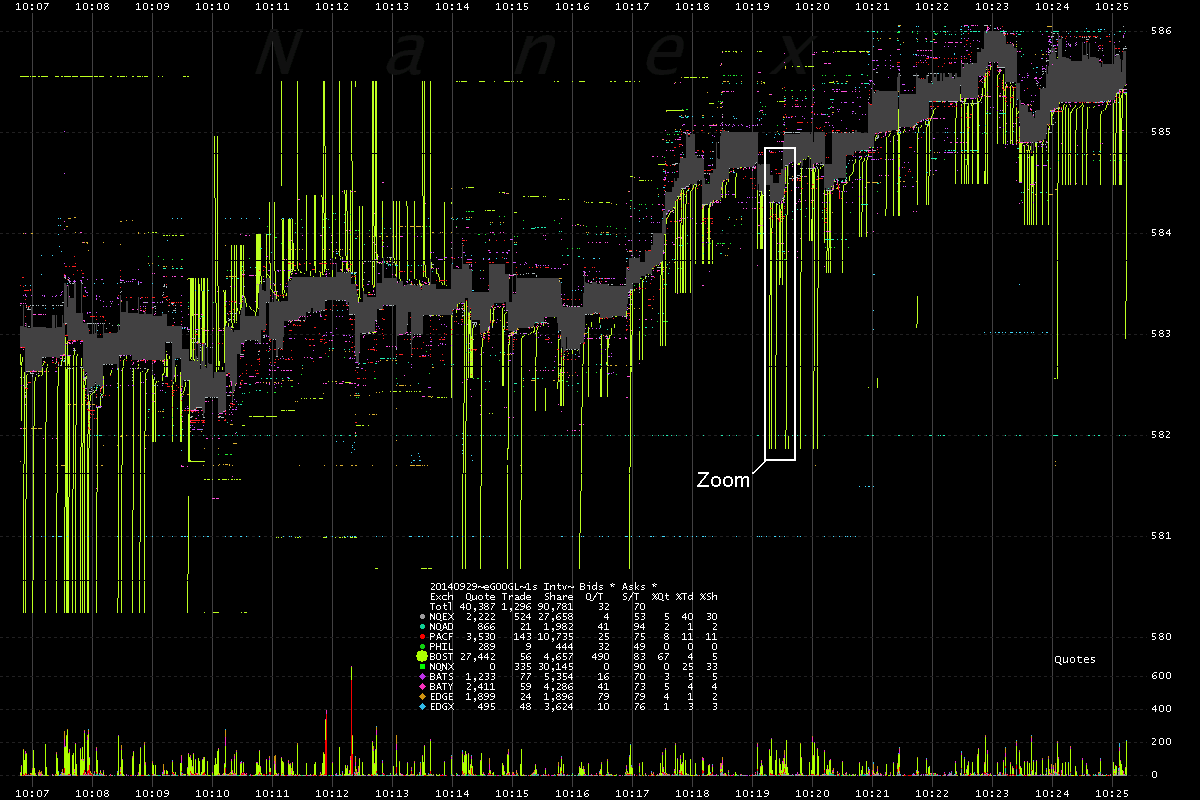
2. Zoomed out to just under 30 seconds of time (the zoom box is detailed in chart 1 at the top).


3. Zoomed out to about 18 minutes of time (the zoom box is detailed in the chart above). Note how often this algo runs!
Each green sliver is made up of one HFT algo's bids or offers changing 1 penny at a time at rates exceeding 100 times and sometimes 1000 times a second.


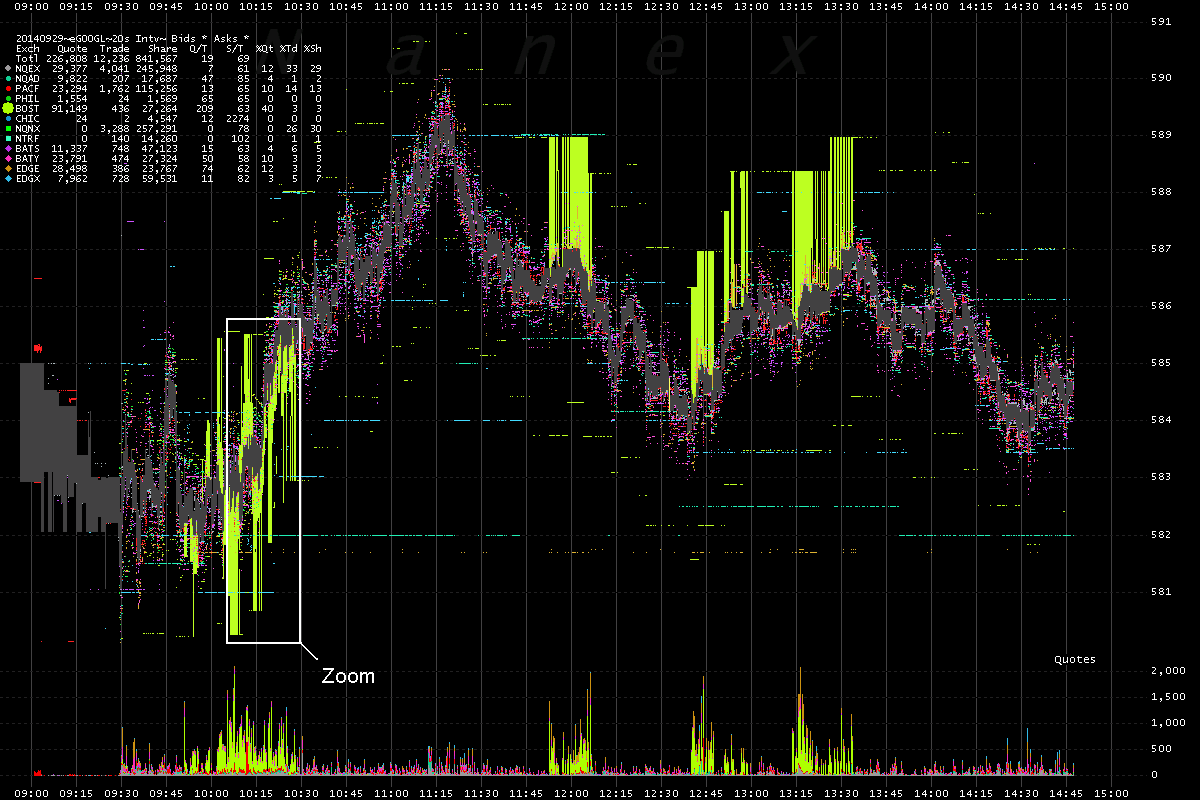
4. Zoomed out showing 9am to about 3pm Eastern Time (the zoom box is detailed in the chart above).
Note the distinct periods of time when this algo runs. Too bad other HFT algo's don't make themselves this visible.


5. Another close-up, showing how the algo does the same thing on the offer size.


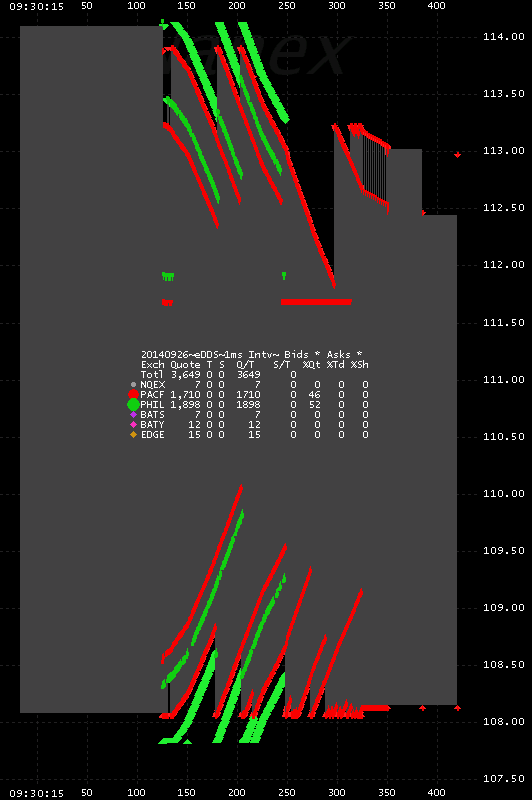
6. A different pattern in a different stock on another day. This involves multiple exchanges and affects the NBBO.
Note: The chart shows 3,549 quote changes in about 1/4 of a second of time. These are not rare! Not many people outside of the exchange datacenter will see these quotes before they expire. Yet everyone will have to process them (because there is no way to know how long before they are canceled).