Over the weekend the world learned of the Senate Republican’s “opening bid” for the next round of fiscal stimulus in the United States. That number came in at a nice, round $1tn. Now, as large as that number is, it still pales in comparison to the $3.5tn House bill that already passed. Importantly, the Senate’s version of stimulus is rather light on some Democrat “must haves” like state and local aid, for example. That is to say, there is quite a chasm between the Senate and House versions of the next round of stimulus. How might investors interpret this chasm and what is the likely resolution?
It’s clear the authorities are still in “whatever it takes” mode, so a compromise does appear to be the most likely scenario as opposed to a breakdown in talks. This is especially so since unemployment remains high and leading indicators of unemployment like initial claims appear to be ticking up again. It’s also clear the House will not get its $3.5tn wish list. So at what level might we find a middle ground?
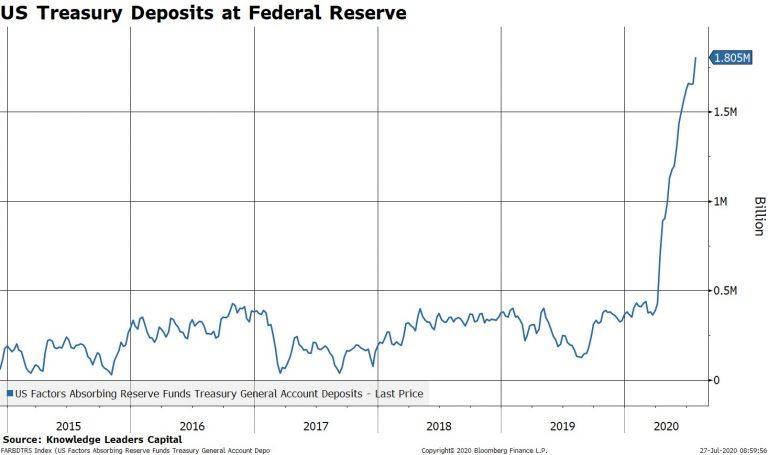
For that, we think the US Treasury Department’s deposits at the Federal Reserve is a good place to start. US Treasury deposits at the Fed is essentially the Treasury’s checking account balance. It’s money that has already been “raised” (AKA printed). It currently stands at $1.8tn vs a normal run rate balance of $400bn on the high side. This implies that $1.4tn is already sitting on the sidelines in the Treasury’s checking account ready to be deployed. In other words, the Treasury has capacity to spend $1.4tn without having to issue more debt. Therefore, this seems like a reasonable dollar amount for the next stimulus package.
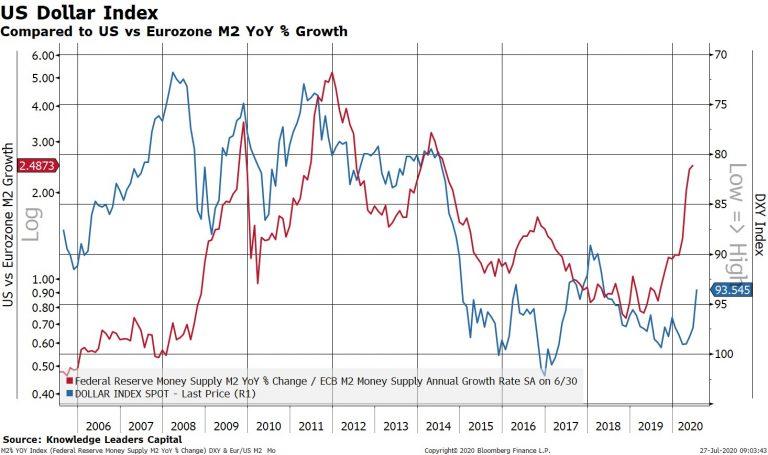
Regardless of the actual number though, what is clear is that deploying that money will increase the money supply even further, even if the velocity (i.e. circulation rate) is still low. That fact is likely to keep the US money supply growing at a faster rate than Eurozone money supply, even with the recent Eurozone stimulus announcement. The relative money supply growth between the US and Eurozone has been a good coincident indicator of the US dollar index, since that index is weighted nearly 60% towards the euro. As of this writing the US dollar index is trading at multi-year lows.
The likely $1tn stimulus plan will also serve to widen the US government’s budget deficit even further, possibly to 20% of GDP. The US budget deficit as a percent of GDP is highly correlated with the level of the US dollar index.

So, we can say with at least a decent level of confidence that the stimulus round in the offing is US dollar bearish. The magnitude of any weakness is a different story and harder to establish ex-ante given the number of variables involved. Of course, the possibility of more than transitory US dollar weakness appears to be growing.
What would it mean for stock market leadership if the US dollar does truly and meaningfully depreciate? It would most likely spell the end of technology leadership and usher in leadership of a different, forgotten group: materials.
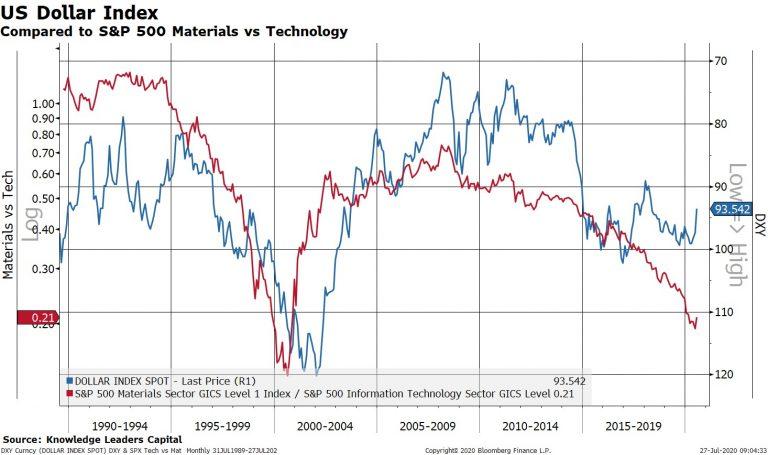
The chart above overlays the US dollar index (blue, right, inverted) against the relative performance of materials vs technology (red line, left). A falling US dollar is highly correlated with materials companies outperforming technology companies. We’re seeing a very, very slight turn in the relative performance differential. Is it the beginning of a new trend or yet another false start?