NYC is slowly emerging from its COVID-19-induced shock, and as politicians clash over what NYC's classrooms will look like next fall (or whether they will reopen at all), thousands of New Yorkers are trying to ditch their city digs and move on out to the suburbs.
Various real estate brokers and market analysts compile data on all aspects of the NYC real estate market. And a recently released survey by Property Shark found that, YoY, sales volume in the city declined by 25%.
But the details of the report are more interesting. As one might expect given its cosmopolitan reputation, Manhattan was the hardest hit of all 5 boroughs. Queens saw its median sales price climb by 10%, while Brooklyn sales activity saw the smallest contraction.
As more signs of life begin to emerge, here's the rest of the report, courtesy of PropertyShark.
With NYC now in Phase Three of reopening and the rest of the state in Phase Four, the residential market’s performance is of heightened interest, after a tumultuous first half of the year.
The year started off promising increased sales activity, only for projections and expectations to be shattered by the uncertainty and upheaval of March, followed by an April marked by historical lows in sales activity and the strongest pricing trends of 2020 by that point.
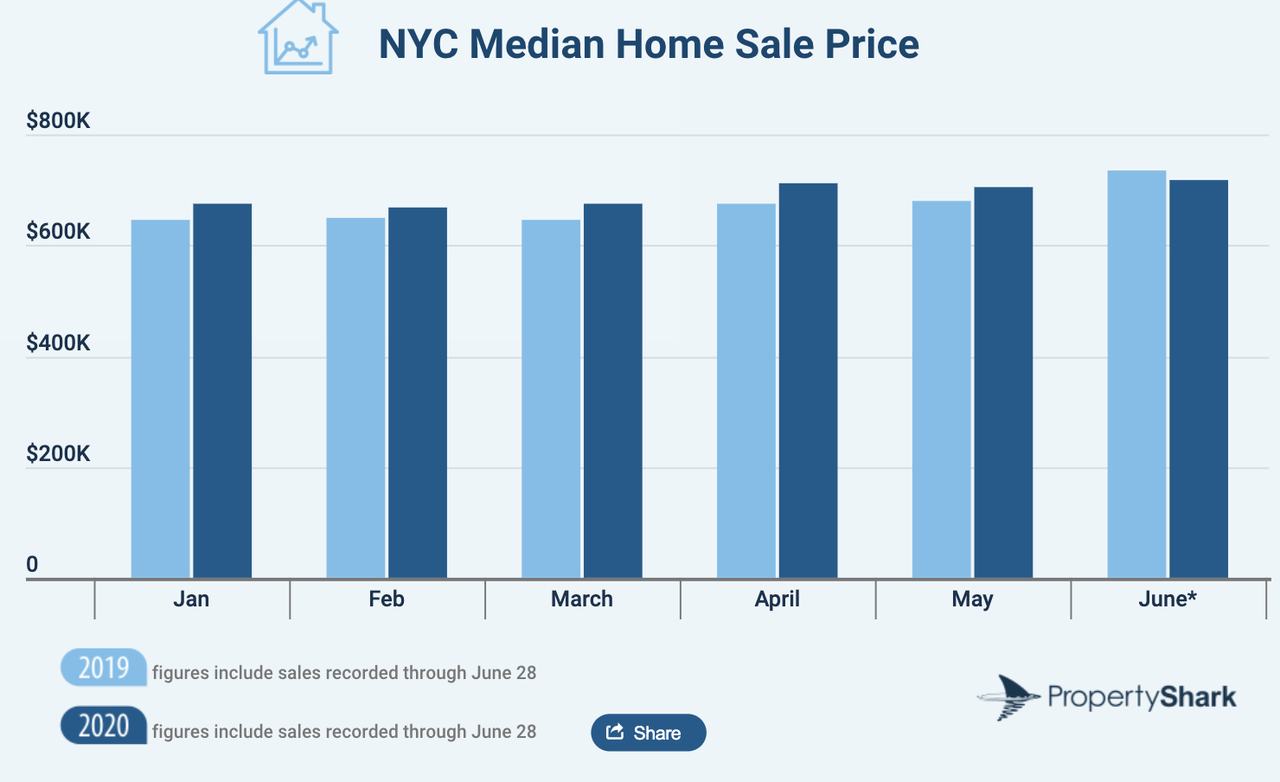
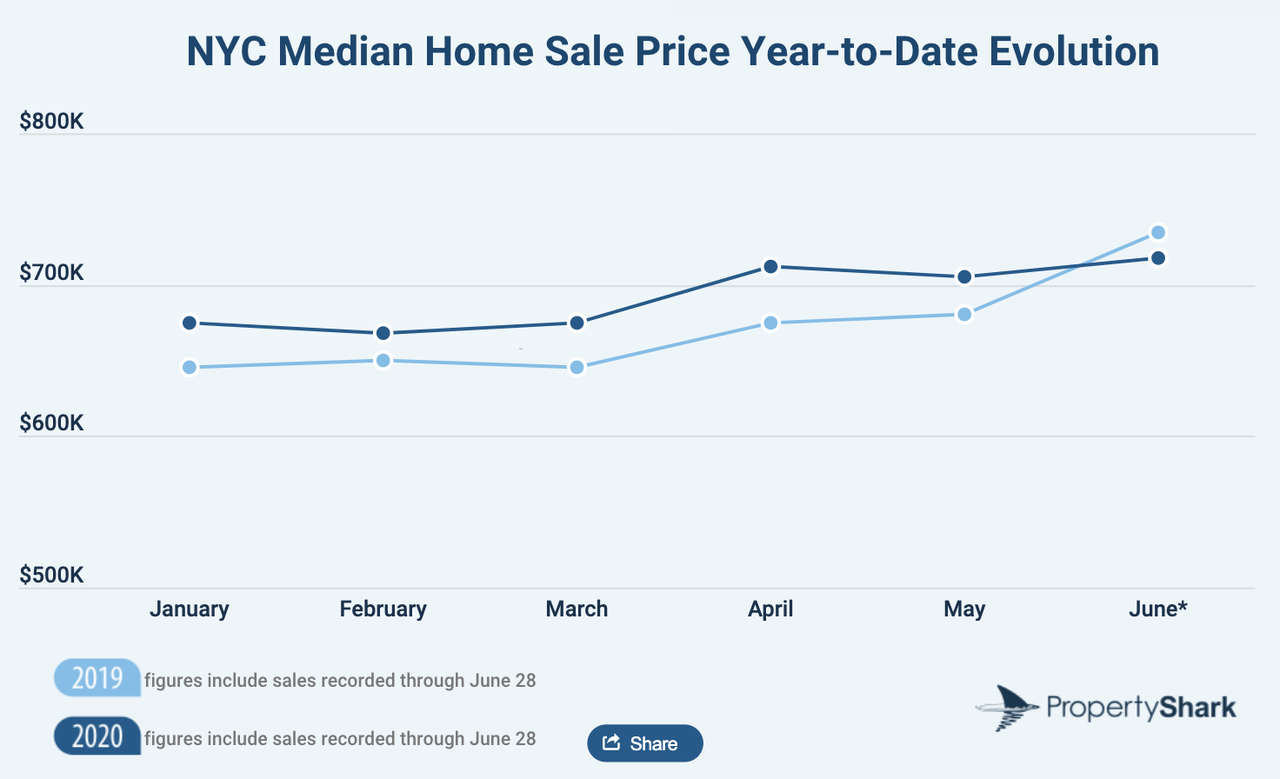
As the curve flattened and the general public started becoming accustomed to the new normal, the state started slowly reopening and brought a tentative return of transactional activity in May. June, however, presented a whole new picture with strengthening sales trends and the first significant year-over-year price drop, despite recording the highest median sale price this year at $717,733.
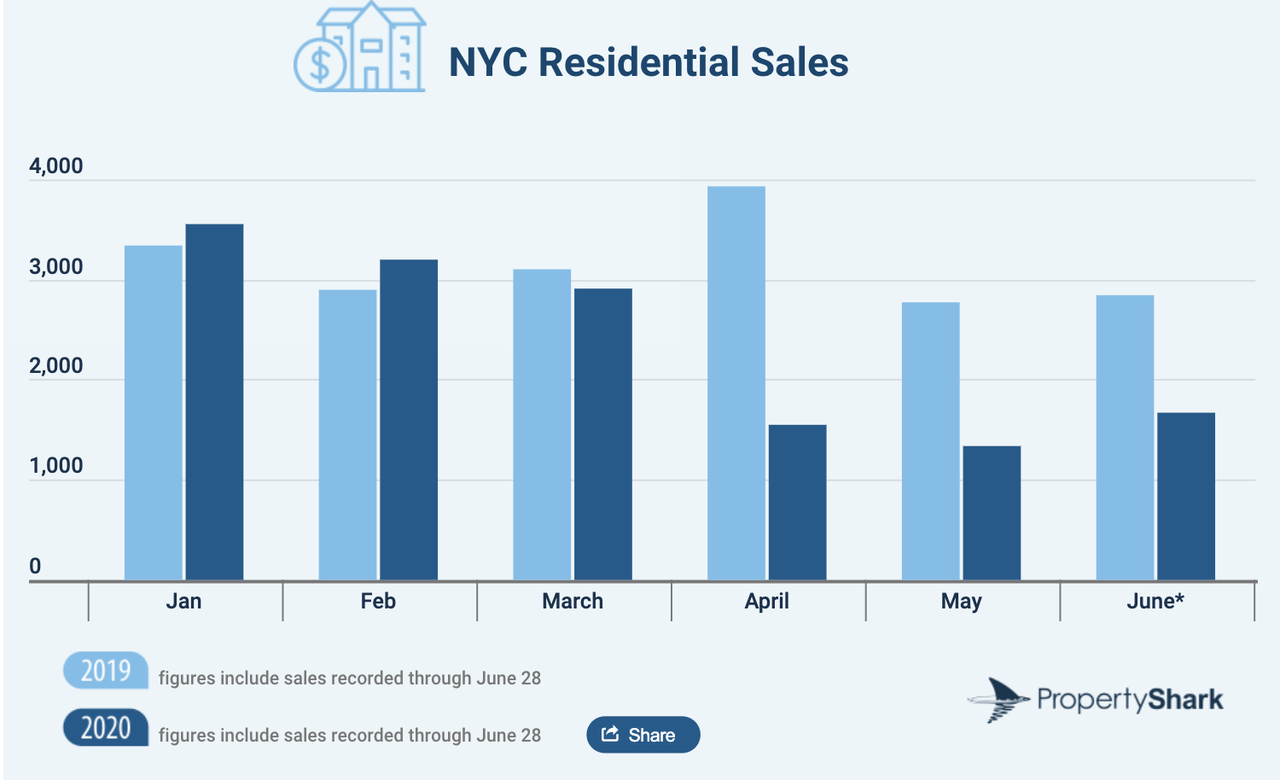
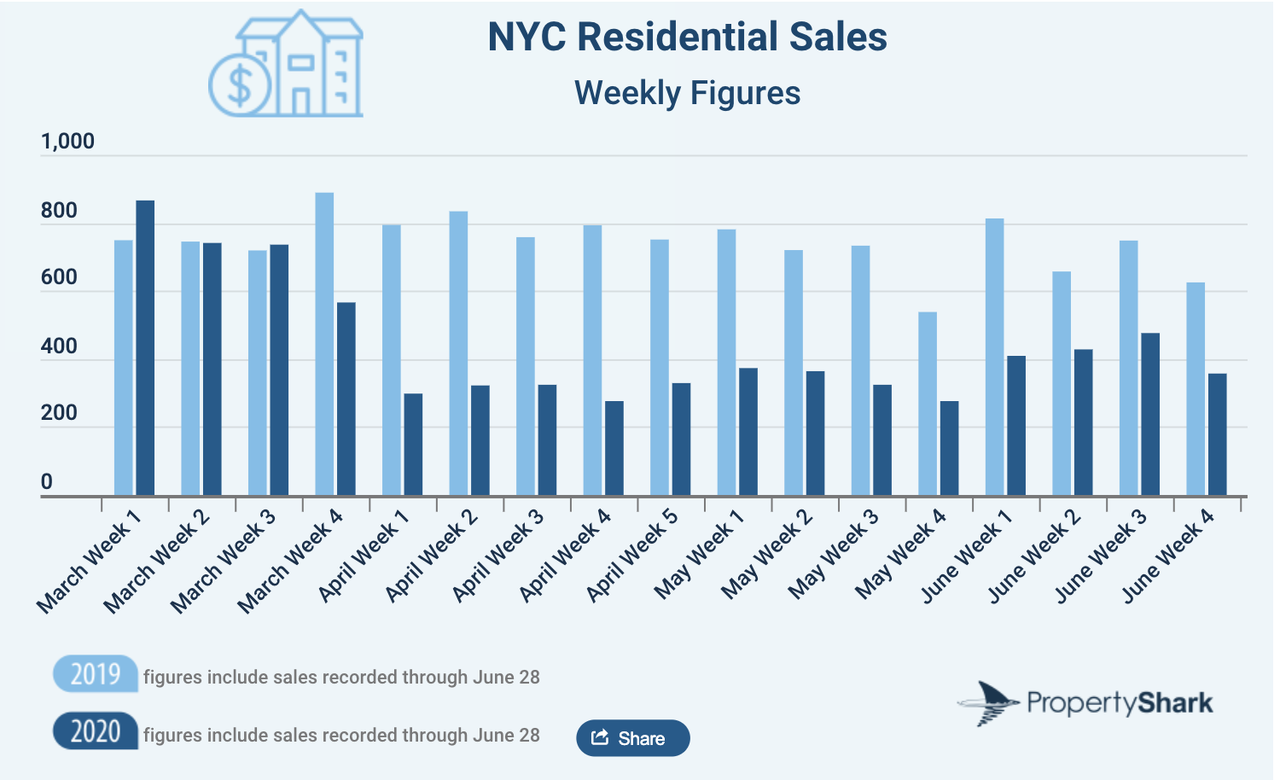
Transactional activity, of course, has trended negative since the start of the crisis. Marched kicked off with sales activity in its first week 15% higher than the same period last year, only to see it drop 36% year-over-year by the end of the month. Sales activity bottomed out in April at 61% below April 2019, with a mere 1,549 deals recorded in the four boroughs in the entire month.
May, however, brought a tentative return of transactional activity, with a total of 1,337 sales recorded. While that figure may have been lower than April’s 1,549 deals, year-over-year, May marked a 52% drop in sales activity, as opposed to April’s 61%. June saw sales trends strengthen further, with its monthly sales activity the highest since the start of the crisis in March, coming in just 41% lower year-over-year.
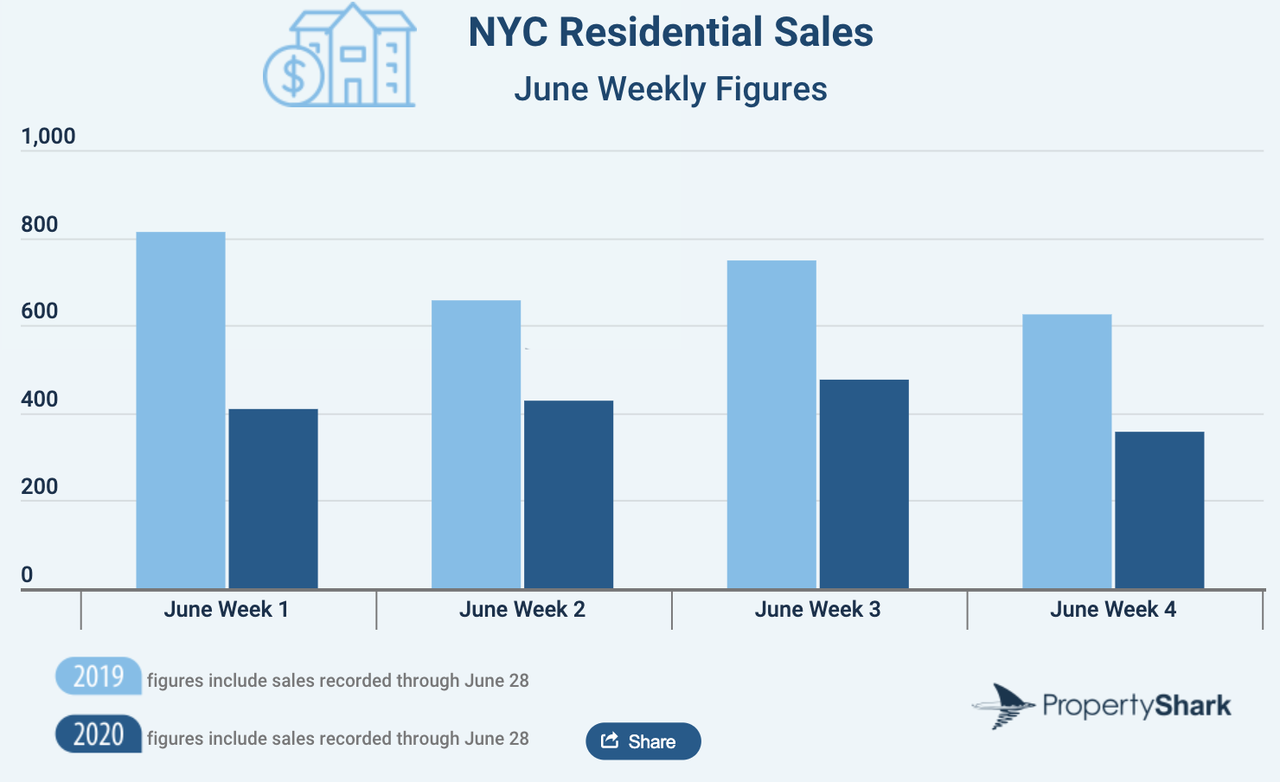
It must be noted that June 2020 figures are skewed beyond the pandemic’s effects, since sales activity and the median sale price surged artificially in June 2019 as NYC buyers and sellers rushed to close deals before the new mansion tax went into effect in July 2019. All in all, 1,670 residential sales were recorded between June 1 and June 28, 2020. Of this, 476 were recorded in the third week of the month, marking the strongest week of sales since late March.
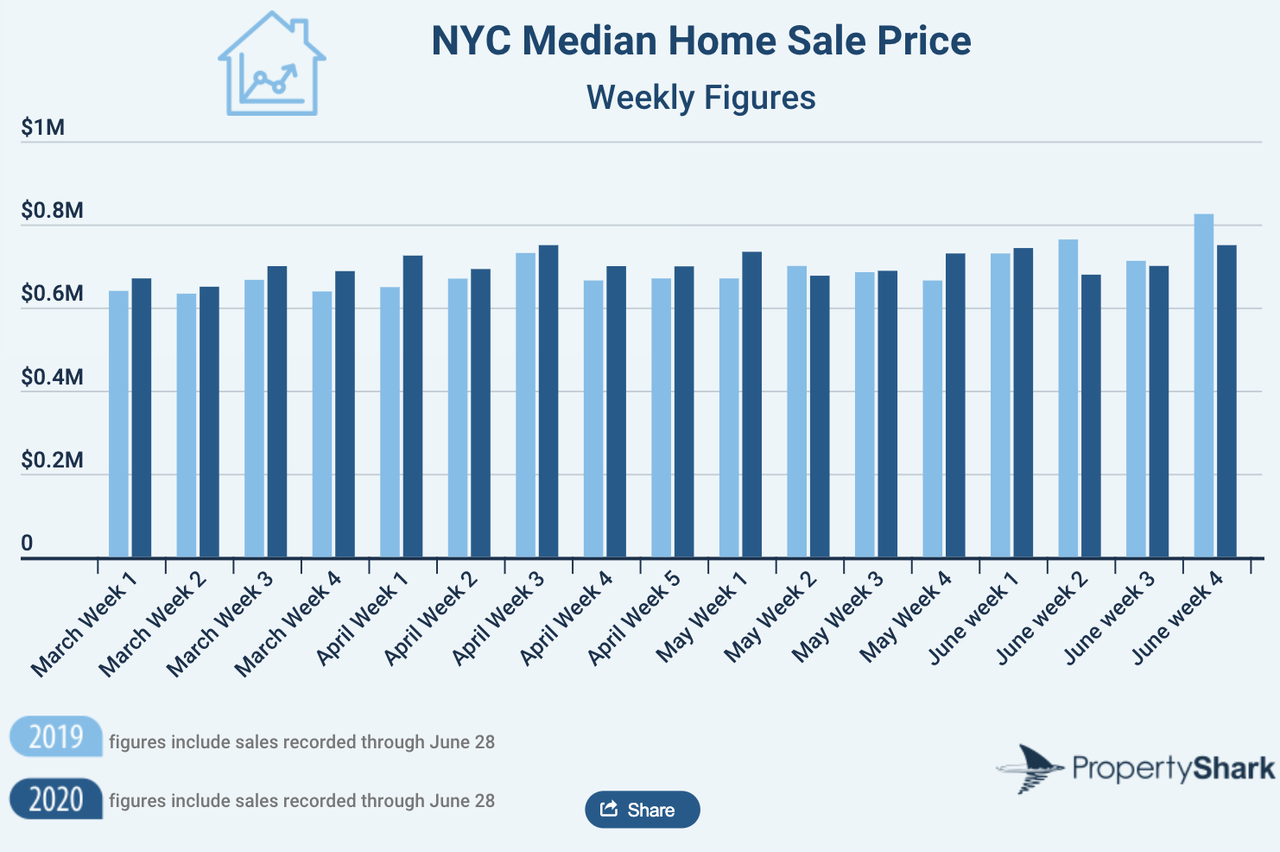
Overall, May 2020 kept up with that trend too, with the exception of one week, which came in a -3% year-over-year. Despite that, May closed with a median sale price of $705,000, marking a 4% gain over May 2019. Additionally, this also made May the second-most expensive month in NYC up to that point, surpassed only by April’s $712,000 median.
June kicked off with the strongest pricing trends so far this year, posting a median sale price of $743,000, surpassing May figures. That represented a 2% gain over year-ago figures, a notable achievement considering June 2019 featured the strongest pricing trends of H1 2019. The rest of the month however, consistently posted weekly median sale prices lower than their year-ago correspondents – again due to the artificially strengthened pricing trends of 2019.
* * * *
Source: PropertyShark.com
